Prerequisites
Slow SQL has been collected and appears on the Slow queries page with governance status fields.Steps
Track progress by reading the governance status fields, following the disposition stage flow, and filtering by optimization status or disposition stage.Governance status fields
Each slow SQL in the Slow queries page table has governance-related fields: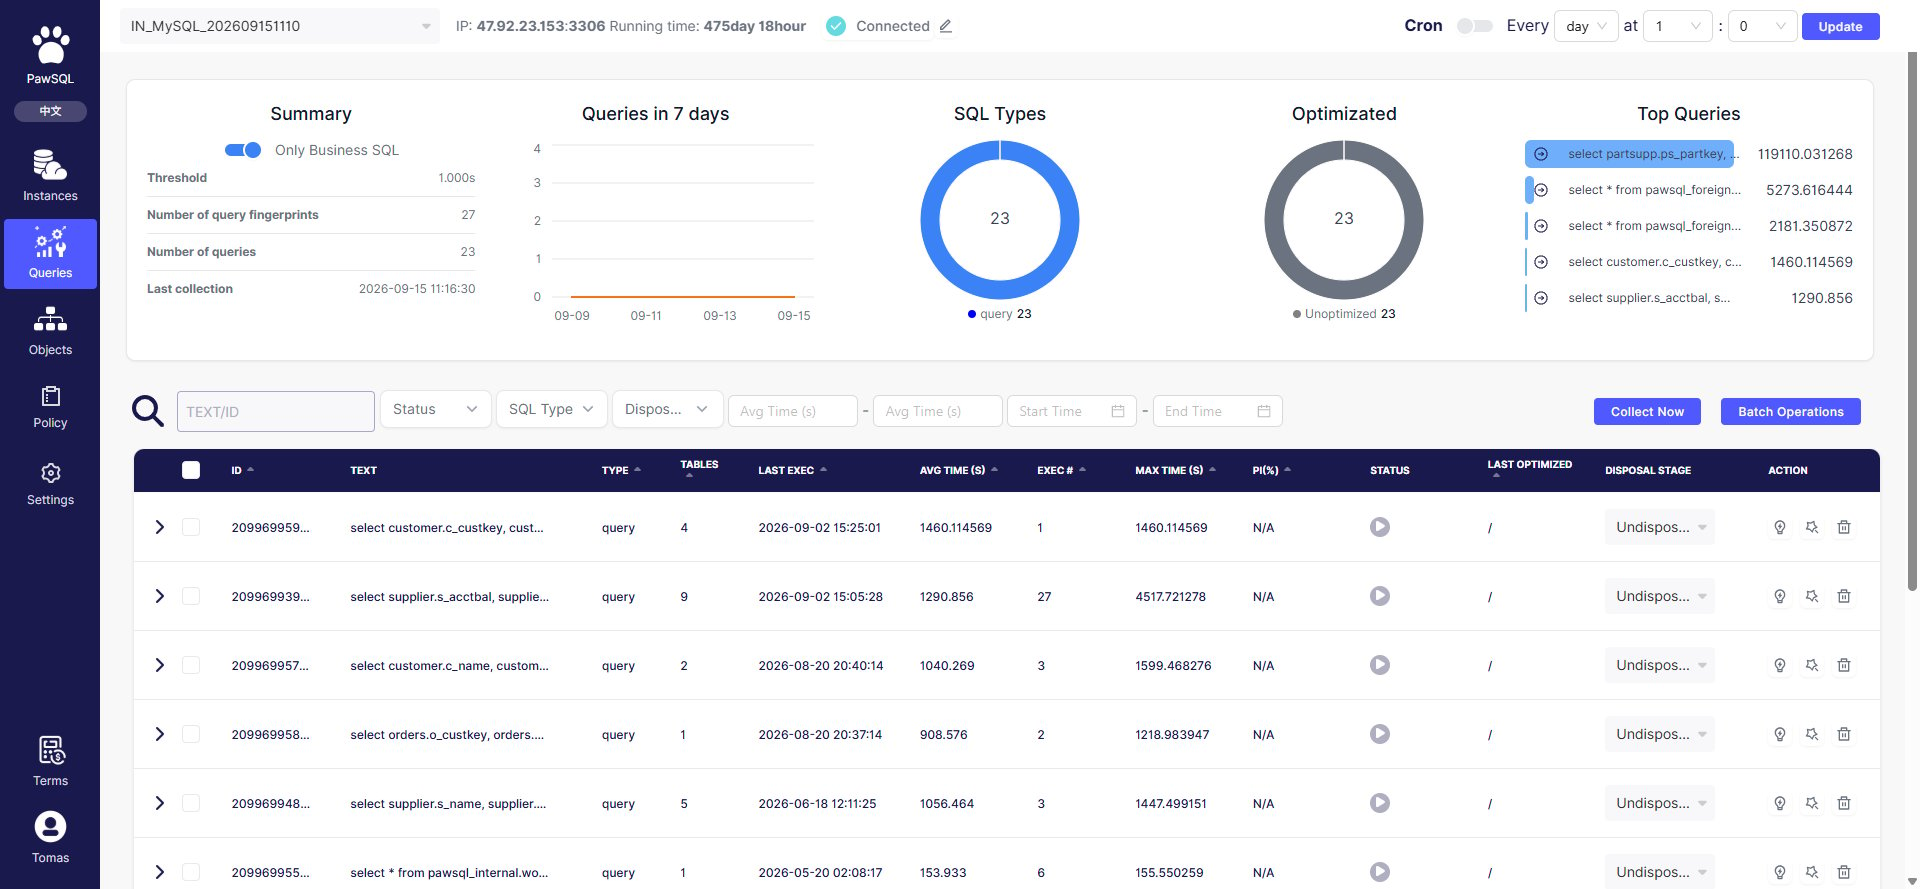
Slow queries page: optimization status, last optimization, disposition stage, and performance gain
Disposition stage flow
Each slow SQL’s “Disposition stage” is a dropdown that moves through three stages over the governance lifecycle:- Not disposed: the default state after collection, before handling begins;
- Disposing: analysis, optimization, or remediation has started;
- Disposed: governance is complete (e.g. optimized or marked ignored).
Filter by status
The Slow queries page filters include “Optimization status” and “Disposition stage”, to focus on “not optimized” or “not disposed” slow SQL. The “Optimization status” chart also counts by status and is clickable to filter. Real sample: an instance’s 23 business SQL were all initially “optimization status: not optimized, disposition stage: not disposed, performance gain: N/A”, meaning governance had not started.Instance overview status
The Instance overview page summarizes collection and patrol status per instance: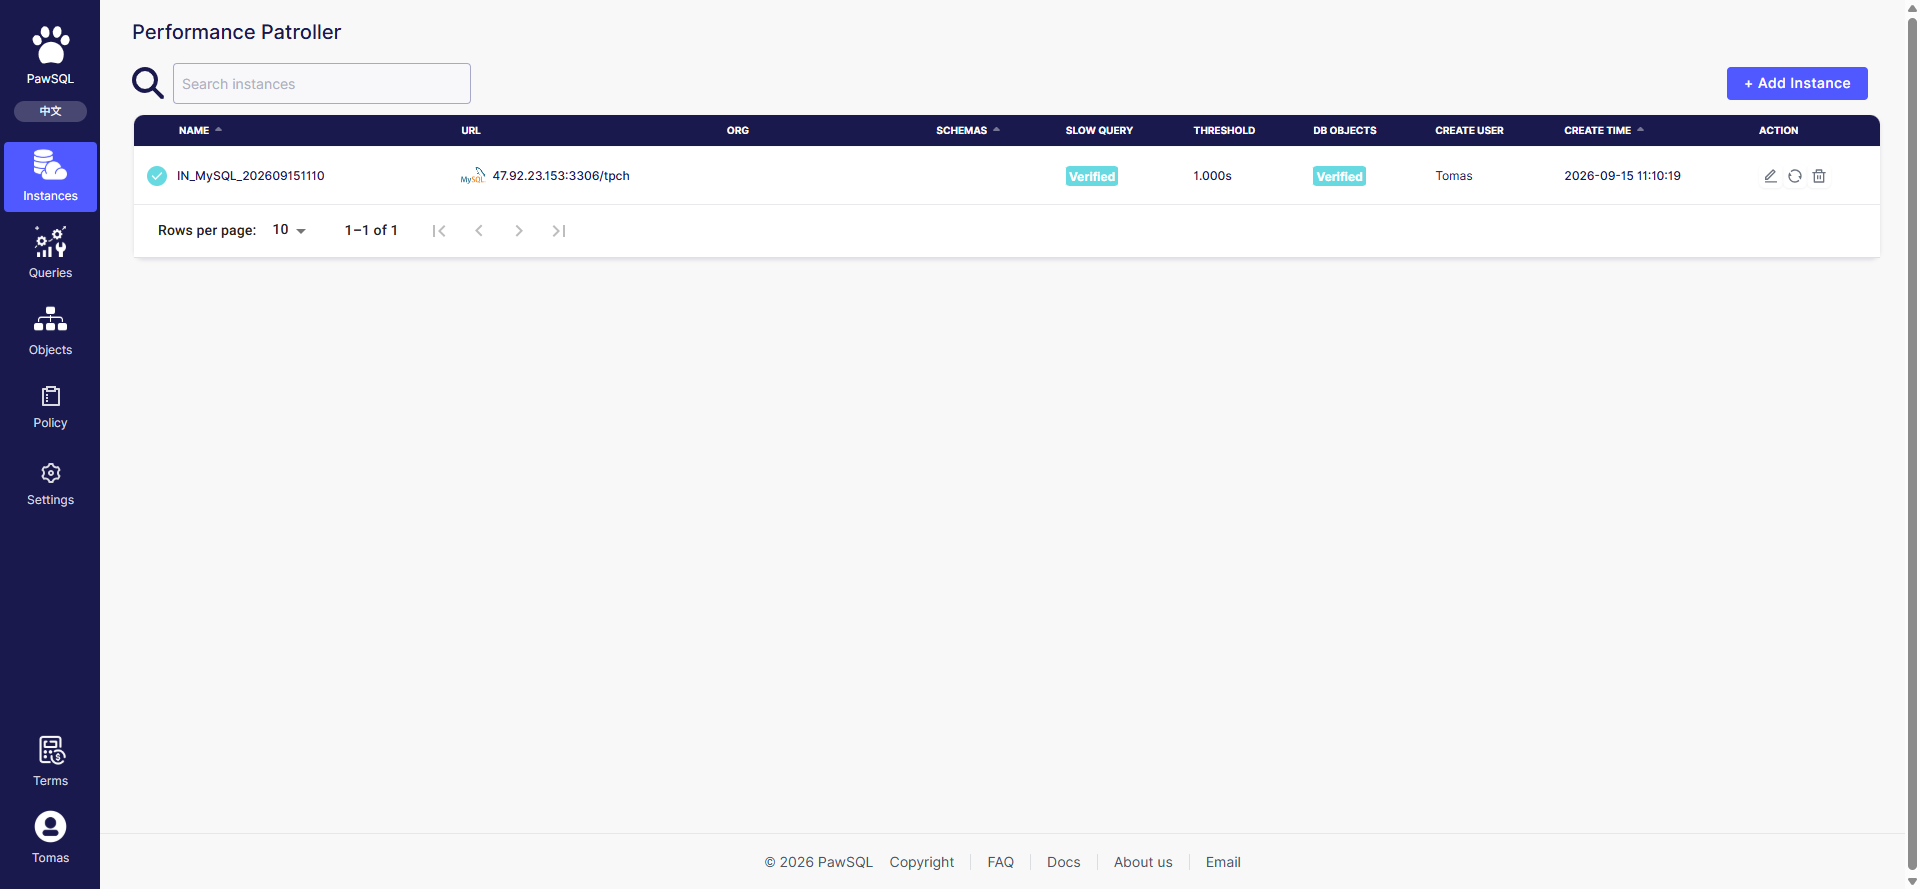
Instance overview: slow query and object patrol status columns
Suggested cadence
- Sort by “Avg latency” first and handle the slowest, most-executed slow SQL;
- Use “Batch operation” to optimize a batch of slow SQL together — see Batch Analysis and Optimization;
- After optimization, review “Performance gain” and advance confirmed SQL to “Disposed”;
- Trigger collection and patrol periodically to keep the backlog current.