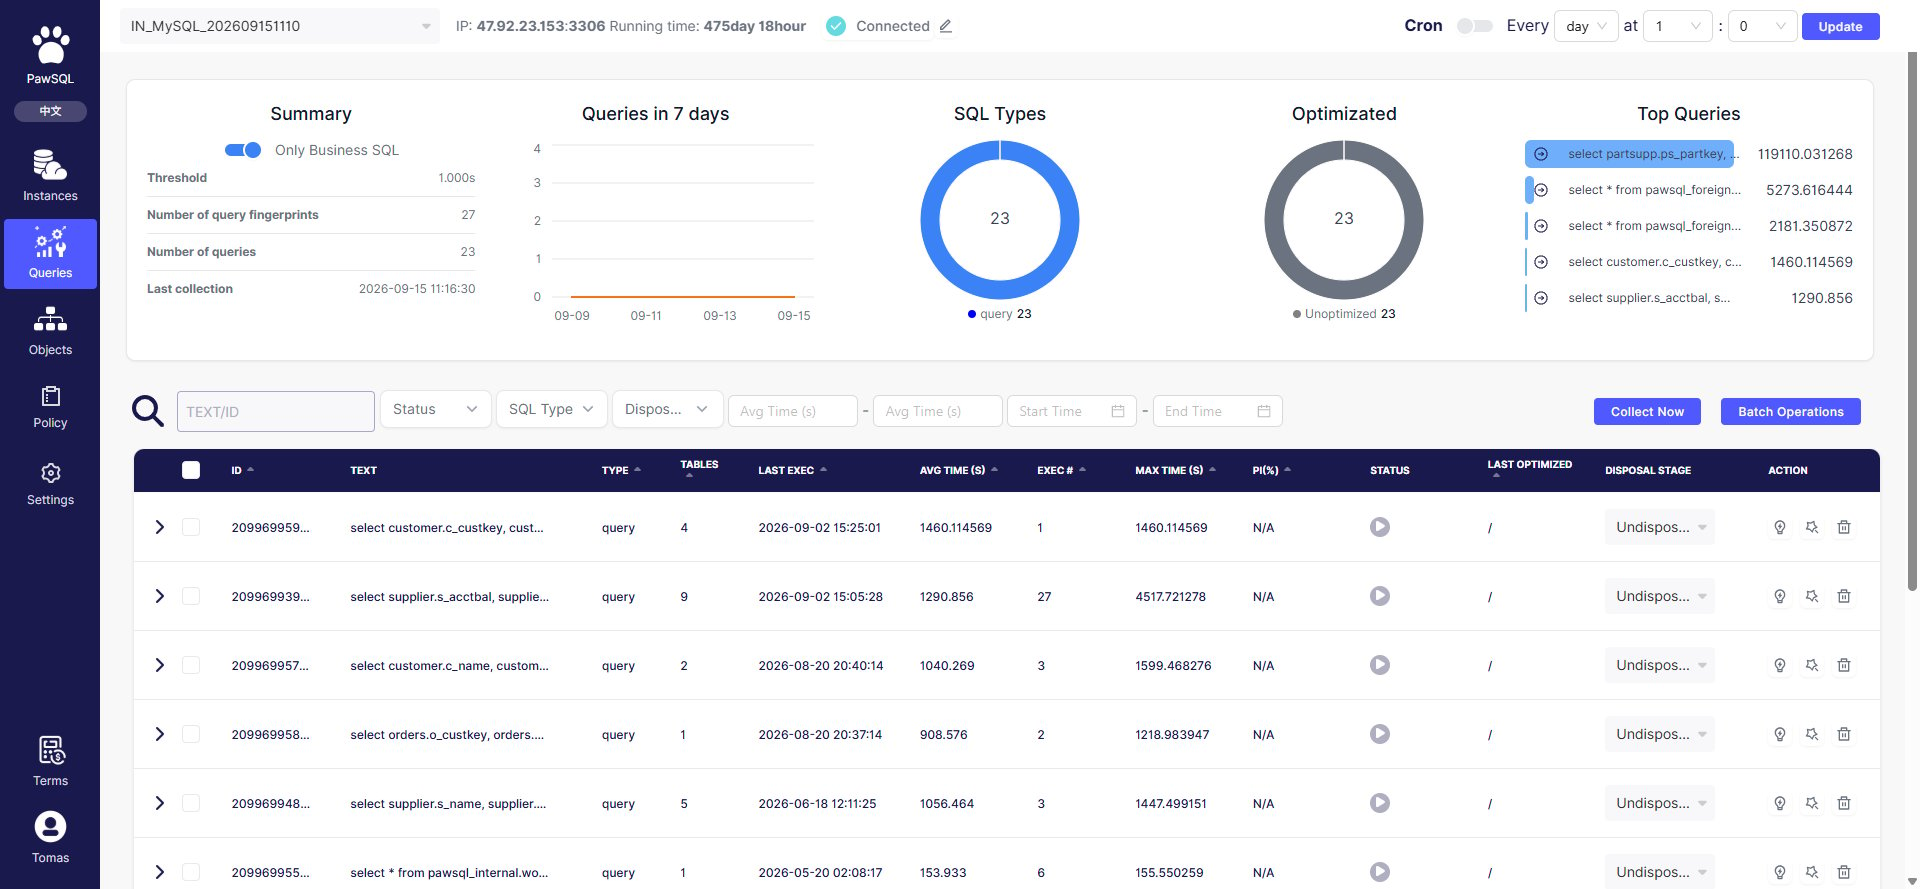
Slow queries page: summary, 7-day slow SQL, SQL type, optimization status, and average latency
Goal
Represent each distinct SQL structure once in the governance backlog by aggregating and deduplicating collected slow SQL.Prerequisites
Slow SQL must already be collected into the platform; aggregation runs on the collection result.Steps
After collection, PawSQL aggregates the slow SQL automatically. Review the backlog with the “Show business SQL only” toggle, the summary metrics, the distribution charts, the table, and the filters.Show business SQL only
The “Show business SQL only” toggle in the top-right of the summary filters out internal/system SQL. It is on by default. Turn it off to show all slow SQL. Real sample: one instance collected27 slow SQL, of which 23 were business SQL — the remaining 4 were internal/system SQL (queries on pawsql_internal.*, pawsql_foreign.*, and similar tables).
Summary metrics
Distribution charts
The Slow queries page summarizes the aggregated backlog with four charts:- 7-day slow SQL: the daily count trend of slow SQL;
- SQL type: the count distribution by SQL type (e.g.
query); - Optimization status: the count distribution by status such as not optimized / optimized;
- Average latency: the slowest SQL by average latency, to prioritize.
query and status “not optimized”, with the slowest one averaging 119110.03 seconds.