Goal
Bring slow queries from the database slow query log into the platform to form the governance backlog.Slow query config step
After the connection passes, the wizard enters “Slow query config”. This step first tests the target database’s slow query log configuration, then sets collection parameters once it passes.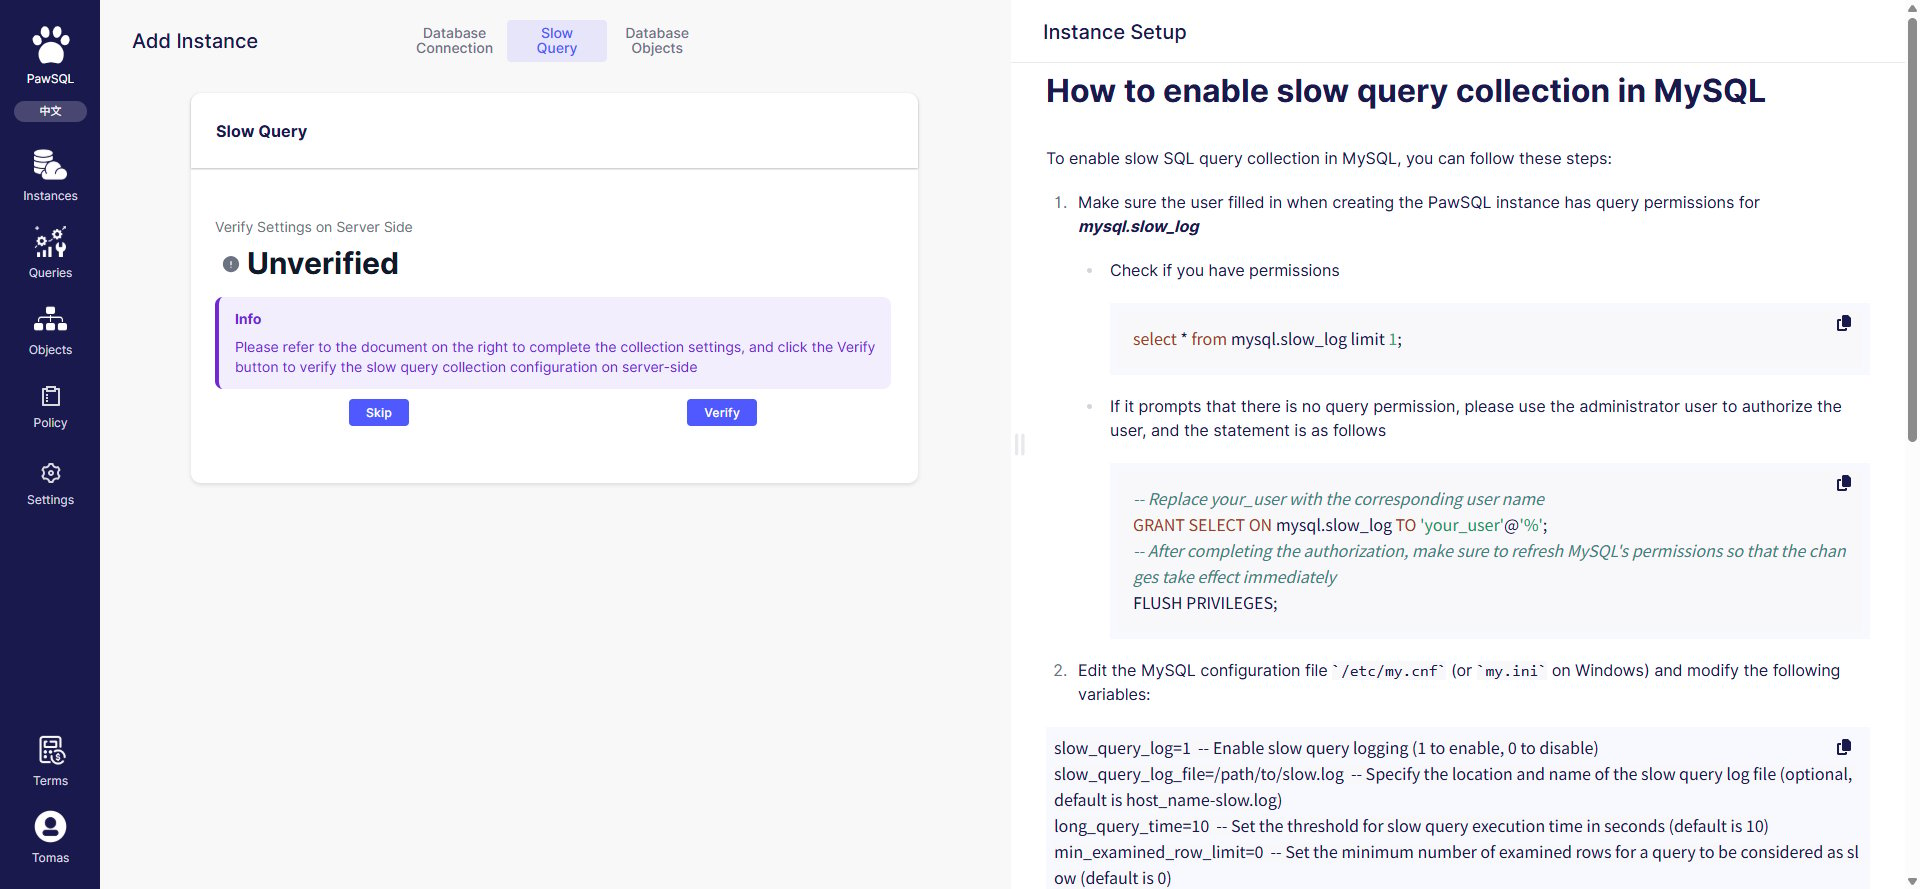
Slow query config: test the database slow query log configuration first
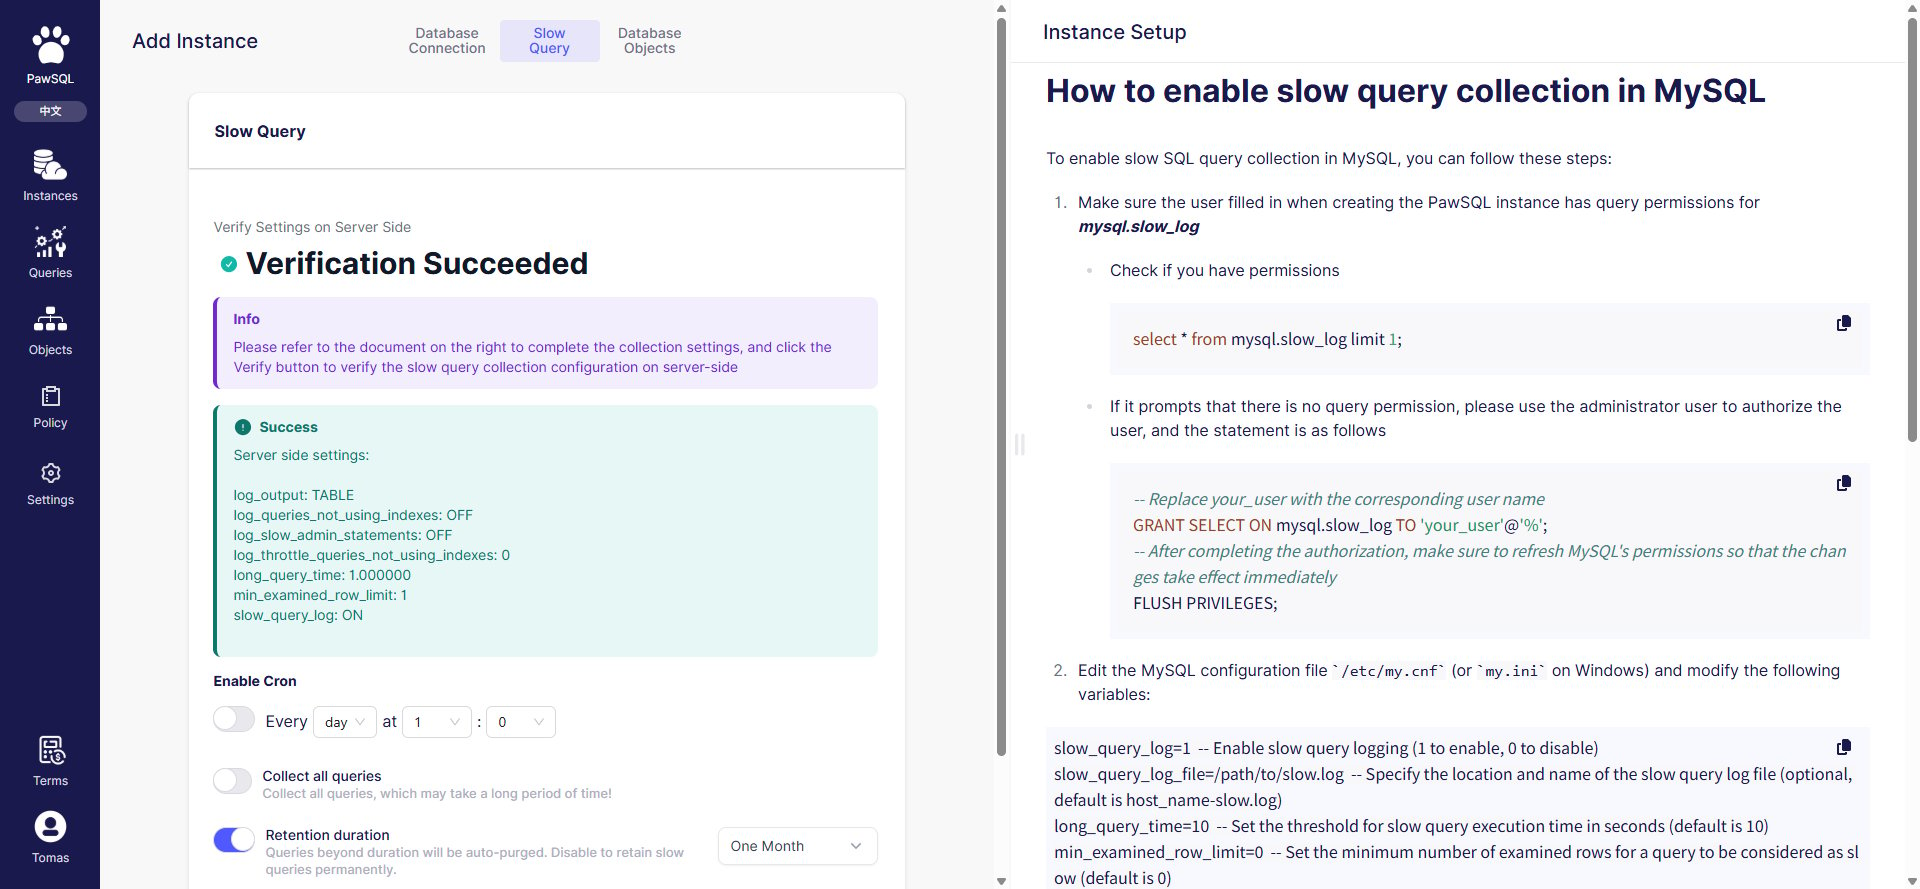
After a successful test, the page shows the slow query log status and collection settings
MySQL slow query log requirements
For MySQL, collection depends on theslow_query_log settings. On a successful test the page shows the parameters (from a real sample):
If the test fails, enable the slow query log per the page’s “Instance setup guide”, or confirm the account has permission to read the slow query log.
Manual collection
Click “Collect” on the Slow queries page to trigger a collection immediately. Collection runs server-side, and the summary updates when it finishes.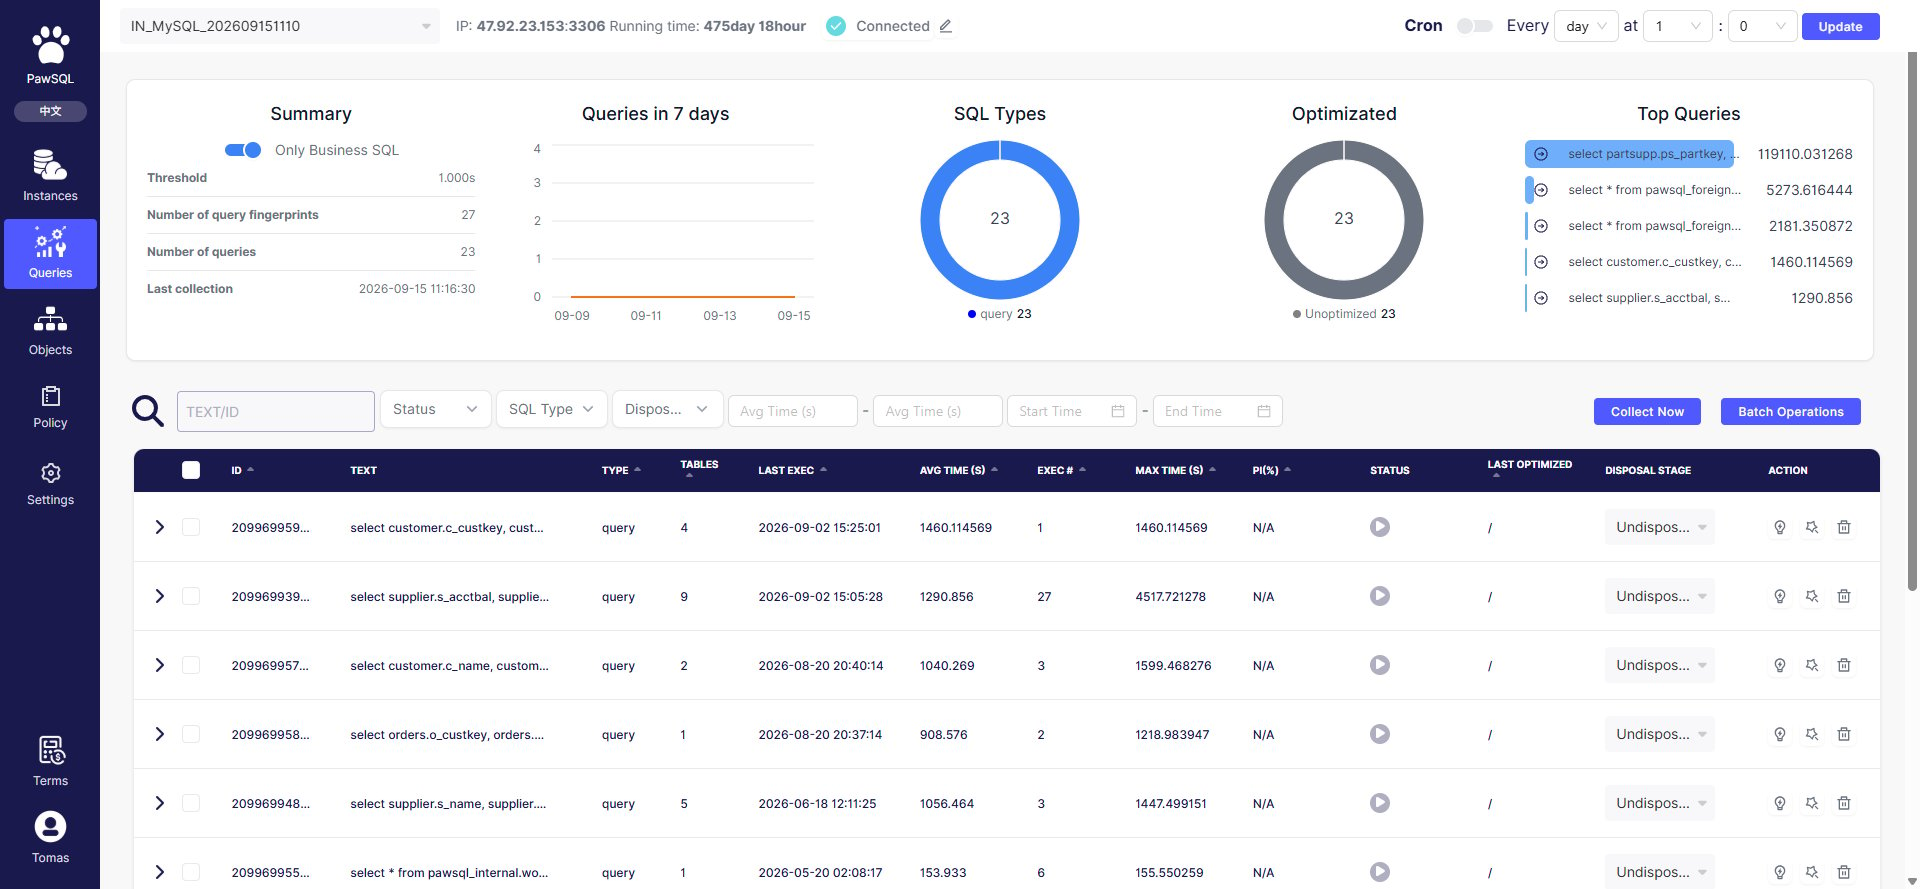
Slow queries page: summary, charts, filters, and Collect / Batch operation
Scheduled collection
At the top of the Slow queries page, turn on “Scheduled collection”, set the interval (every N days) and the time (at HH:MM), then click “Update”. The platform then collects automatically on schedule.Scope and semantics
- Collected SQL comes from the database slow query log, so SQL below the threshold or from a disabled log is not collected;
- The difference between “Slow SQL count” and “Business SQL count” is whether internal/system SQL is filtered — see SQL Aggregation and Deduplication;
- Collection accumulates incrementally; re-collecting refreshes the latest collection time and updates the list.
Expected Result
After collection, the Slow queries page summary shows the slow query threshold, slow SQL count, business SQL count, and latest collection time for the collected data.Before you submit
- The database slow query log is enabled;
- The threshold matches the governance goal (too low introduces noise);
- The account can read the slow query log;
- The summary updates after manual collection.