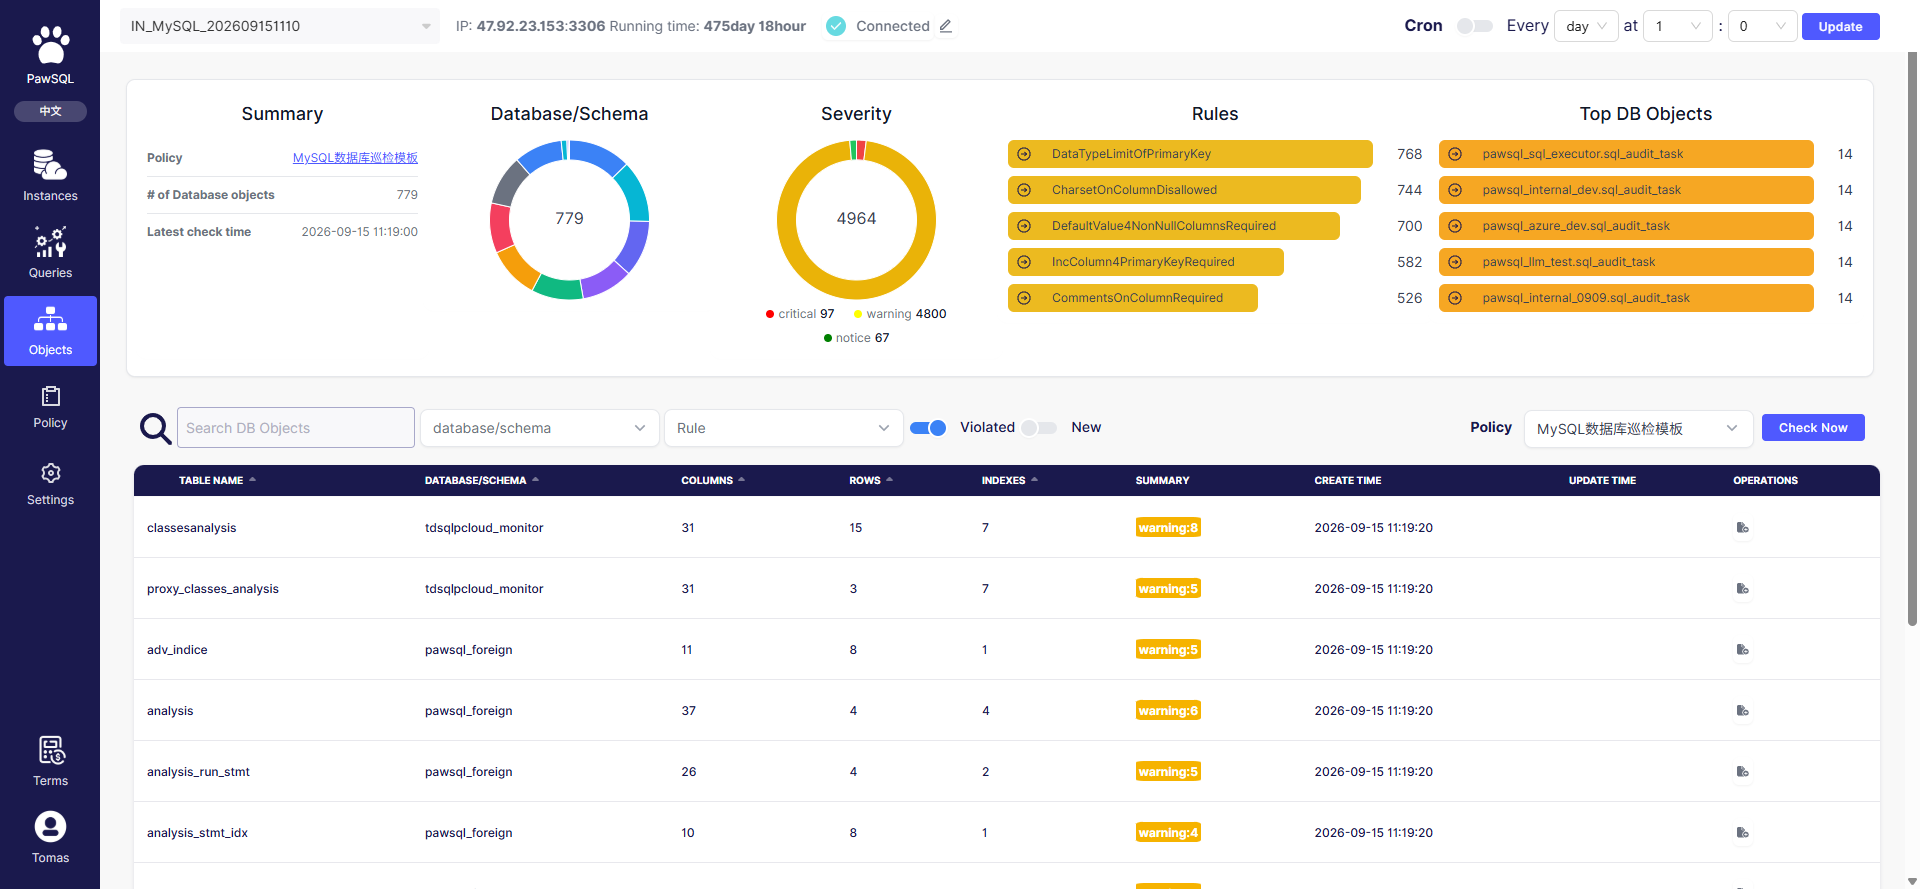
Database object patrol report: summary, severity, audit rules, and object list
Goal
Review the patrol report on the Database objects page to judge instance health and locate the objects needing remediation.Prerequisites
A patrol has completed so the Database objects page has findings to summarize.Steps
Read the report top-down: the summary overview, the severity distribution, the top audit rules, the top database objects, and finally the drillable object list.Summary
Severity distribution
The “Severity” chart counts findings across three levels — critical / warning / notice. Real sample: of4964 findings, 97 critical, 4800 warning, and 67 notice. Click a level to filter the object list by that severity.
Top audit rules
The “Audit rules” chart lists the most frequently triggered rules, revealing common issues. In a real sample the top rules were:Top database objects
The “Database objects” chart lists the objects (tables) with the most findings, to prioritize remediation. In a real sample, thesql_audit_task tables across pawsql_* databases each had 14 findings.
Object list
The object table lists each table with structural information and patrol results:
Above the table are filters: search database objects, database/schema, violated rules, and “Violated rules” and “New” toggles to show only objects with issues or newly added objects.
Expected Result
The Database objects page shows the patrol summary, the severity chart, the audit rules chart, the database objects chart, and a filterable object list with each table’s anomalies.Verification
Confirm the summary reflects the latest patrol, and that clicking a severity level or rule filters the object list accordingly.Related pages
- Instance overview: cross-instance metrics, 7-day slow SQL, and database patrol Top 5 — see Performance Governance Workflow;
- Patrol templates: view and maintain the rule sets used for patrol;
- Configuration: maintain optimization-related global settings.