> ## Documentation Index
> Fetch the complete documentation index at: https://docs.pawsql.com/llms.txt
> Use this file to discover all available pages before exploring further.
> ## Agent Instructions
> PawSQL 是一个产品:Cloud 是公网部署形态,Engine / Optimizer / Auditor / Advisor / Patroller 是同一产品的组件与交付形态,不是彼此独立的产品。 / PawSQL is a single product: Cloud is the public deployment form, while Engine / Optimizer / Auditor / Advisor / Patroller are components and delivery forms of the same product, not separate products.
> 术语以站内术语表为准:SQL 审核对应英文 SQL Review,查询重写对应 Query Rewrite,索引推荐对应 Index Recommendation;英文内容统一用 Review,不用 Audit。 / Use the site glossary for terminology: 审核 is SQL Review, 重写 is Query Rewrite, 索引推荐 is Index Recommendation; English content uses Review, never Audit.
> 引用能力范围或版本支持时以对应页面为准;标注 unknown、或 status 非 published 的内容表示尚未经产品核实,不应作为事实引用。 / Cite capability scope and version support from the corresponding page; content marked unknown, or with a status other than published, is not yet product-verified and must not be cited as fact.
# Track Governance Progress
> Track each slow SQL and each instance via the optimization status, disposition stage, and performance gain on the Slow queries page and the status columns on the Instance overview page.
Slow query governance is an ongoing process. PawSQL tracks each slow SQL's progress across three dimensions — optimization status, disposition stage, and performance gain — and summarizes collection and patrol status per instance on the Instance overview page.
## Prerequisites
Slow SQL has been collected and appears on the Slow queries page with governance status fields.
## Steps
Track progress by reading the governance status fields, following the disposition stage flow, and filtering by optimization status or disposition stage.
## Governance status fields
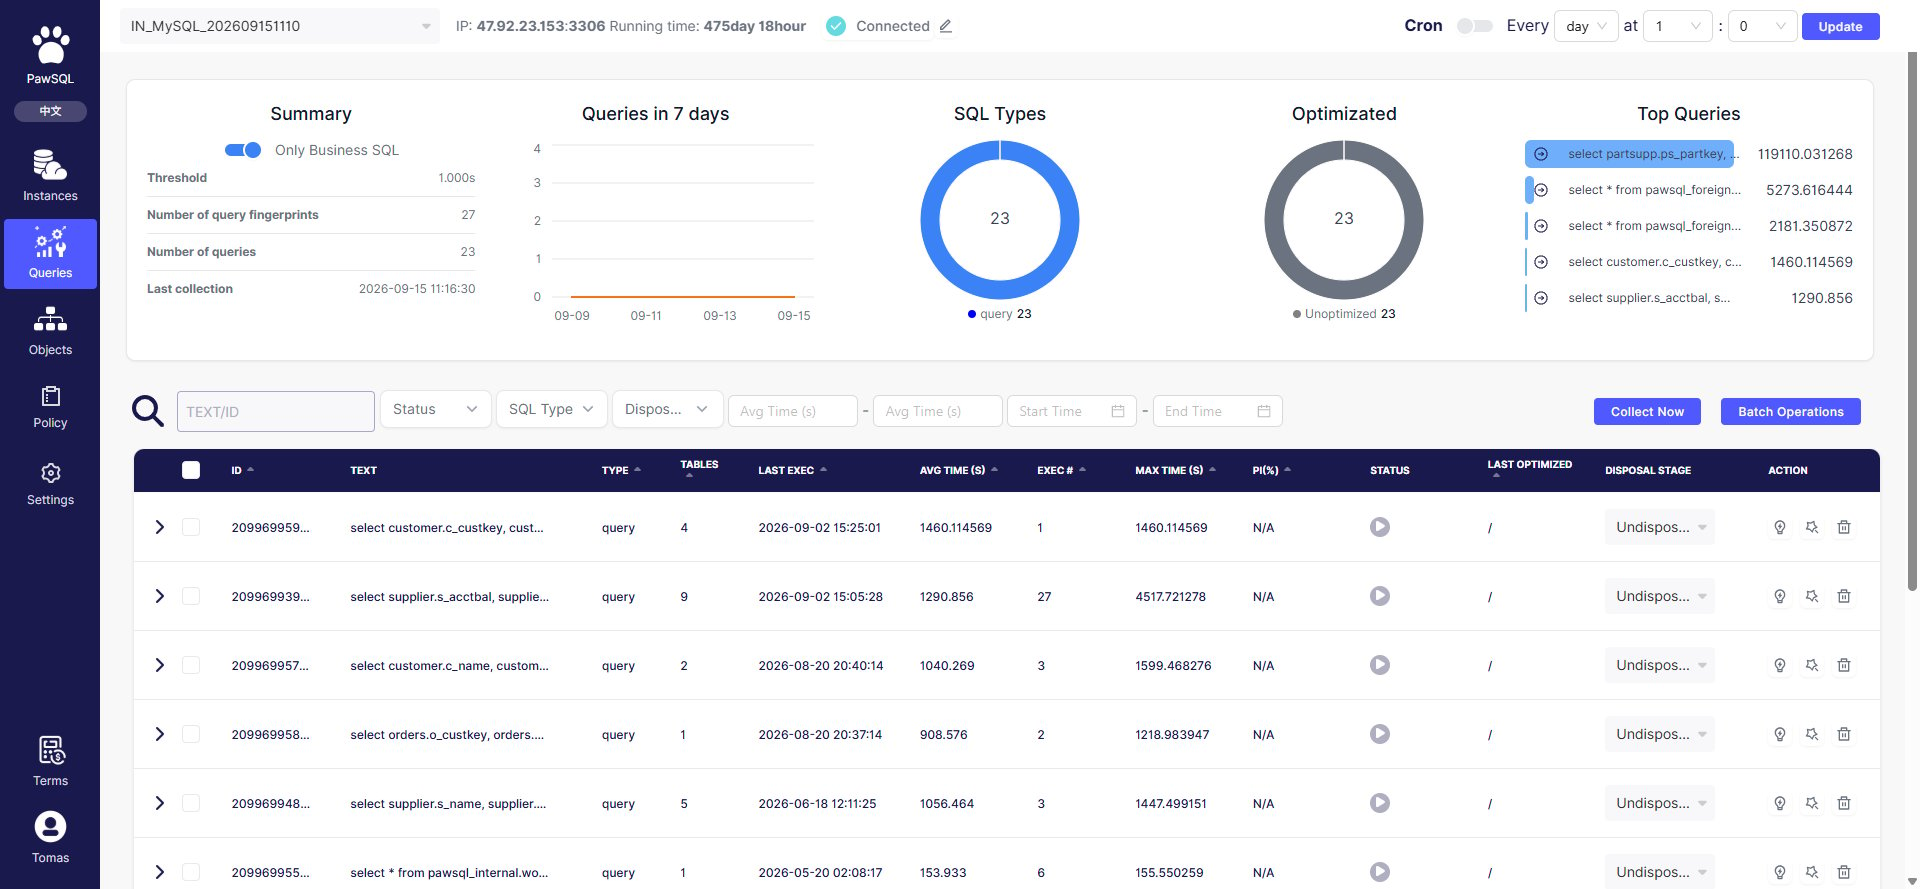
Each slow SQL in the Slow queries page table has governance-related fields:
 | Field | Values | Meaning |
| -------------------- | ----------------------------------- | ------------------------------------------------------------------ |
| Optimization status | Not optimized / optimized | Whether an optimization result has been generated for the SQL |
| Last optimization | Time or `/` | The most recent optimization time; empty when not optimized |
| Disposition stage | Not disposed / disposing / disposed | The governance disposition stage |
| Performance gain (%) | Percentage or `N/A` | Improvement relative to the original SQL; `N/A` when not optimized |
## Disposition stage flow
Each slow SQL's "Disposition stage" is a dropdown that moves through three stages over the governance lifecycle:
```
Not disposed → Disposing → Disposed
```
* **Not disposed**: the default state after collection, before handling begins;
* **Disposing**: analysis, optimization, or remediation has started;
* **Disposed**: governance is complete (e.g. optimized or marked ignored).
The disposition stage is updated manually to sync governance progress within the team.
## Filter by status
The Slow queries page filters include "Optimization status" and "Disposition stage", to focus on "not optimized" or "not disposed" slow SQL. The "Optimization status" chart also counts by status and is clickable to filter.
Real sample: an instance's 23 business SQL were all initially "optimization status: not optimized, disposition stage: not disposed, performance gain: N/A", meaning governance had not started.
## Instance overview status
The Instance overview page summarizes collection and patrol status per instance:
| Field | Values | Meaning |
| -------------------- | ----------------------------------- | ------------------------------------------------------------------ |
| Optimization status | Not optimized / optimized | Whether an optimization result has been generated for the SQL |
| Last optimization | Time or `/` | The most recent optimization time; empty when not optimized |
| Disposition stage | Not disposed / disposing / disposed | The governance disposition stage |
| Performance gain (%) | Percentage or `N/A` | Improvement relative to the original SQL; `N/A` when not optimized |
## Disposition stage flow
Each slow SQL's "Disposition stage" is a dropdown that moves through three stages over the governance lifecycle:
```
Not disposed → Disposing → Disposed
```
* **Not disposed**: the default state after collection, before handling begins;
* **Disposing**: analysis, optimization, or remediation has started;
* **Disposed**: governance is complete (e.g. optimized or marked ignored).
The disposition stage is updated manually to sync governance progress within the team.
## Filter by status
The Slow queries page filters include "Optimization status" and "Disposition stage", to focus on "not optimized" or "not disposed" slow SQL. The "Optimization status" chart also counts by status and is clickable to filter.
Real sample: an instance's 23 business SQL were all initially "optimization status: not optimized, disposition stage: not disposed, performance gain: N/A", meaning governance had not started.
## Instance overview status
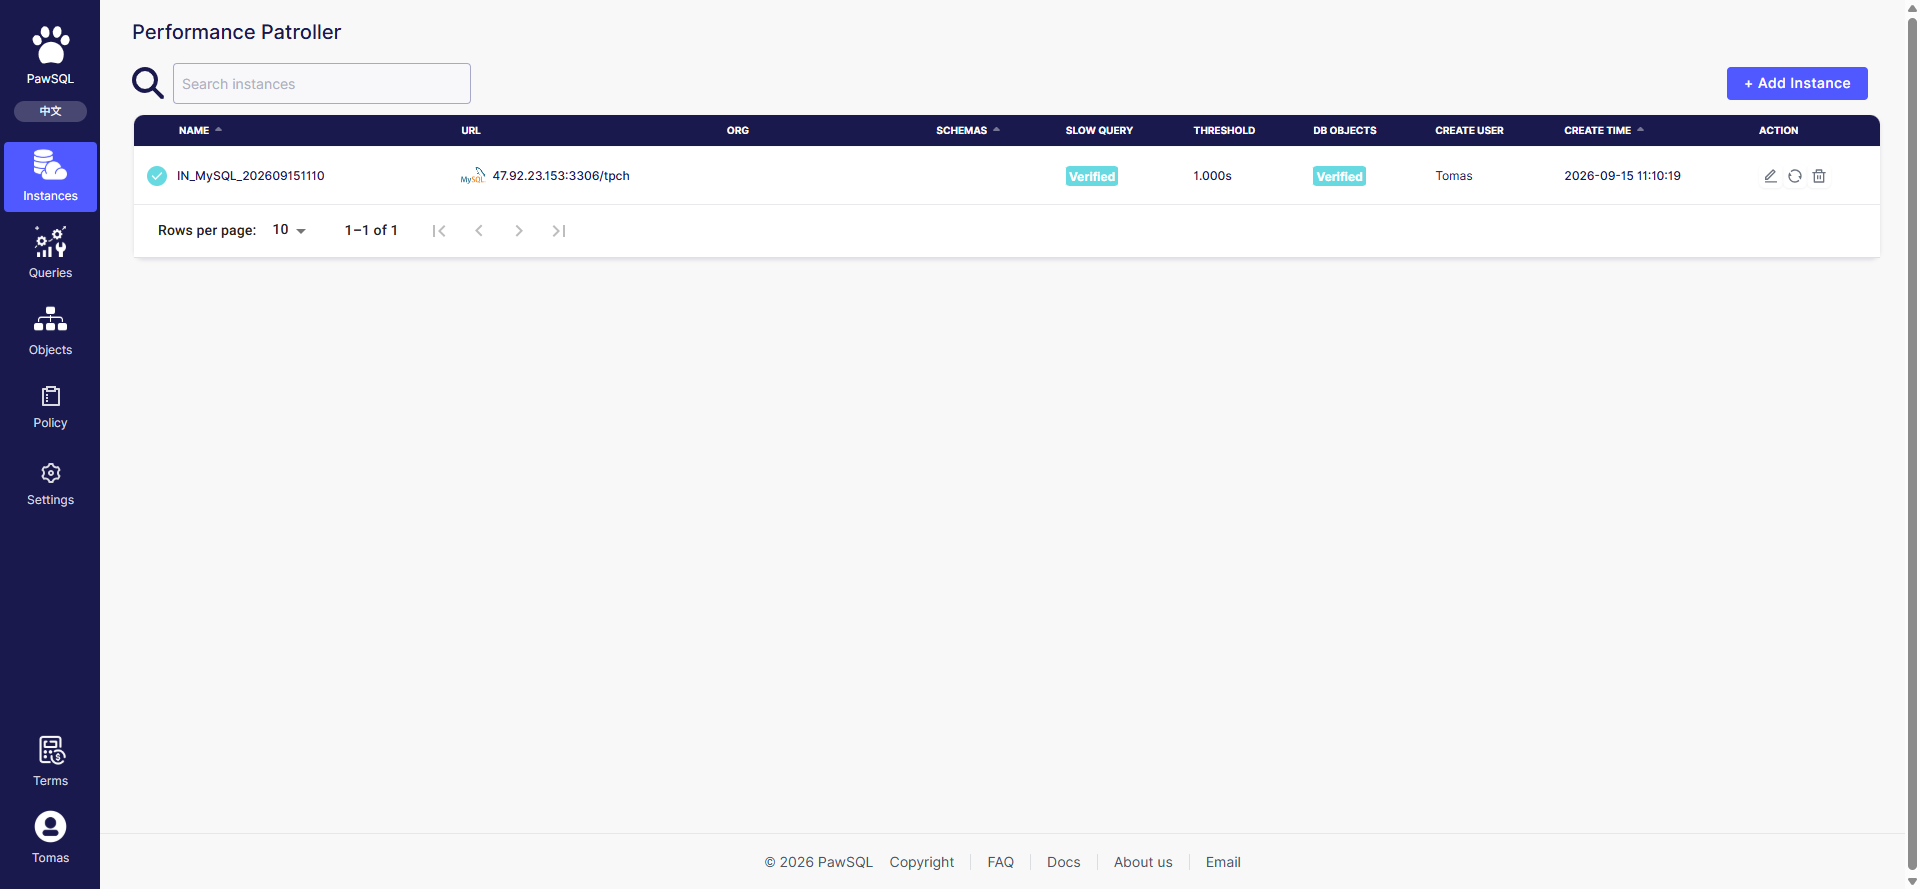
The Instance overview page summarizes collection and patrol status per instance:
 | Column | Meaning |
| -------------------- | -------------------------------------------------- |
| Slow queries | Whether slow query config has been verified |
| Slow query threshold | The threshold used for collection on this instance |
| Object patrol | Whether patrol config has been verified |
## Suggested cadence
1. Sort by "Avg latency" first and handle the slowest, most-executed slow SQL;
2. Use "Batch operation" to optimize a batch of slow SQL together — see [Batch Analysis and Optimization](/en/user-guide/performance/batch-optimize);
3. After optimization, review "Performance gain" and advance confirmed SQL to "Disposed";
4. Trigger collection and patrol periodically to keep the backlog current.
## Expected Result
Each slow SQL shows its optimization status, disposition stage, and performance gain; the Instance overview page summarizes collection and patrol status per instance.
## Verification
Confirm the status fields update as optimization completes and the disposition stage advances through not disposed → disposing → disposed.
## Related reading
| Column | Meaning |
| -------------------- | -------------------------------------------------- |
| Slow queries | Whether slow query config has been verified |
| Slow query threshold | The threshold used for collection on this instance |
| Object patrol | Whether patrol config has been verified |
## Suggested cadence
1. Sort by "Avg latency" first and handle the slowest, most-executed slow SQL;
2. Use "Batch operation" to optimize a batch of slow SQL together — see [Batch Analysis and Optimization](/en/user-guide/performance/batch-optimize);
3. After optimization, review "Performance gain" and advance confirmed SQL to "Disposed";
4. Trigger collection and patrol periodically to keep the backlog current.
## Expected Result
Each slow SQL shows its optimization status, disposition stage, and performance gain; the Instance overview page summarizes collection and patrol status per instance.
## Verification
Confirm the status fields update as optimization completes and the disposition stage advances through not disposed → disposing → disposed.
## Related reading