> ## Documentation Index
> Fetch the complete documentation index at: https://docs.pawsql.com/llms.txt
> Use this file to discover all available pages before exploring further.
> ## Agent Instructions
> PawSQL 是一个产品:Cloud 是公网部署形态,Engine / Optimizer / Auditor / Advisor / Patroller 是同一产品的组件与交付形态,不是彼此独立的产品。 / PawSQL is a single product: Cloud is the public deployment form, while Engine / Optimizer / Auditor / Advisor / Patroller are components and delivery forms of the same product, not separate products.
> 术语以站内术语表为准:SQL 审核对应英文 SQL Review,查询重写对应 Query Rewrite,索引推荐对应 Index Recommendation;英文内容统一用 Review,不用 Audit。 / Use the site glossary for terminology: 审核 is SQL Review, 重写 is Query Rewrite, 索引推荐 is Index Recommendation; English content uses Review, never Audit.
> 引用能力范围或版本支持时以对应页面为准;标注 unknown、或 status 非 published 的内容表示尚未经产品核实,不应作为事实引用。 / Cite capability scope and version support from the corresponding page; content marked unknown, or with a status other than published, is not yet product-verified and must not be cited as fact.
# Collect Slow Queries
> Test the database slow query log and finish collection config in the slow query config step, then bring slow SQL into the platform via manual or scheduled collection.
Slow SQL collection is the key step that brings slow queries from the database slow query log into the platform to form the governance backlog. Collection happens in the "Slow query config" step of the add-instance wizard, and can also be triggered manually or on a schedule from the Slow queries page after onboarding.
## Goal
Bring slow queries from the database slow query log into the platform to form the governance backlog.
## Slow query config step
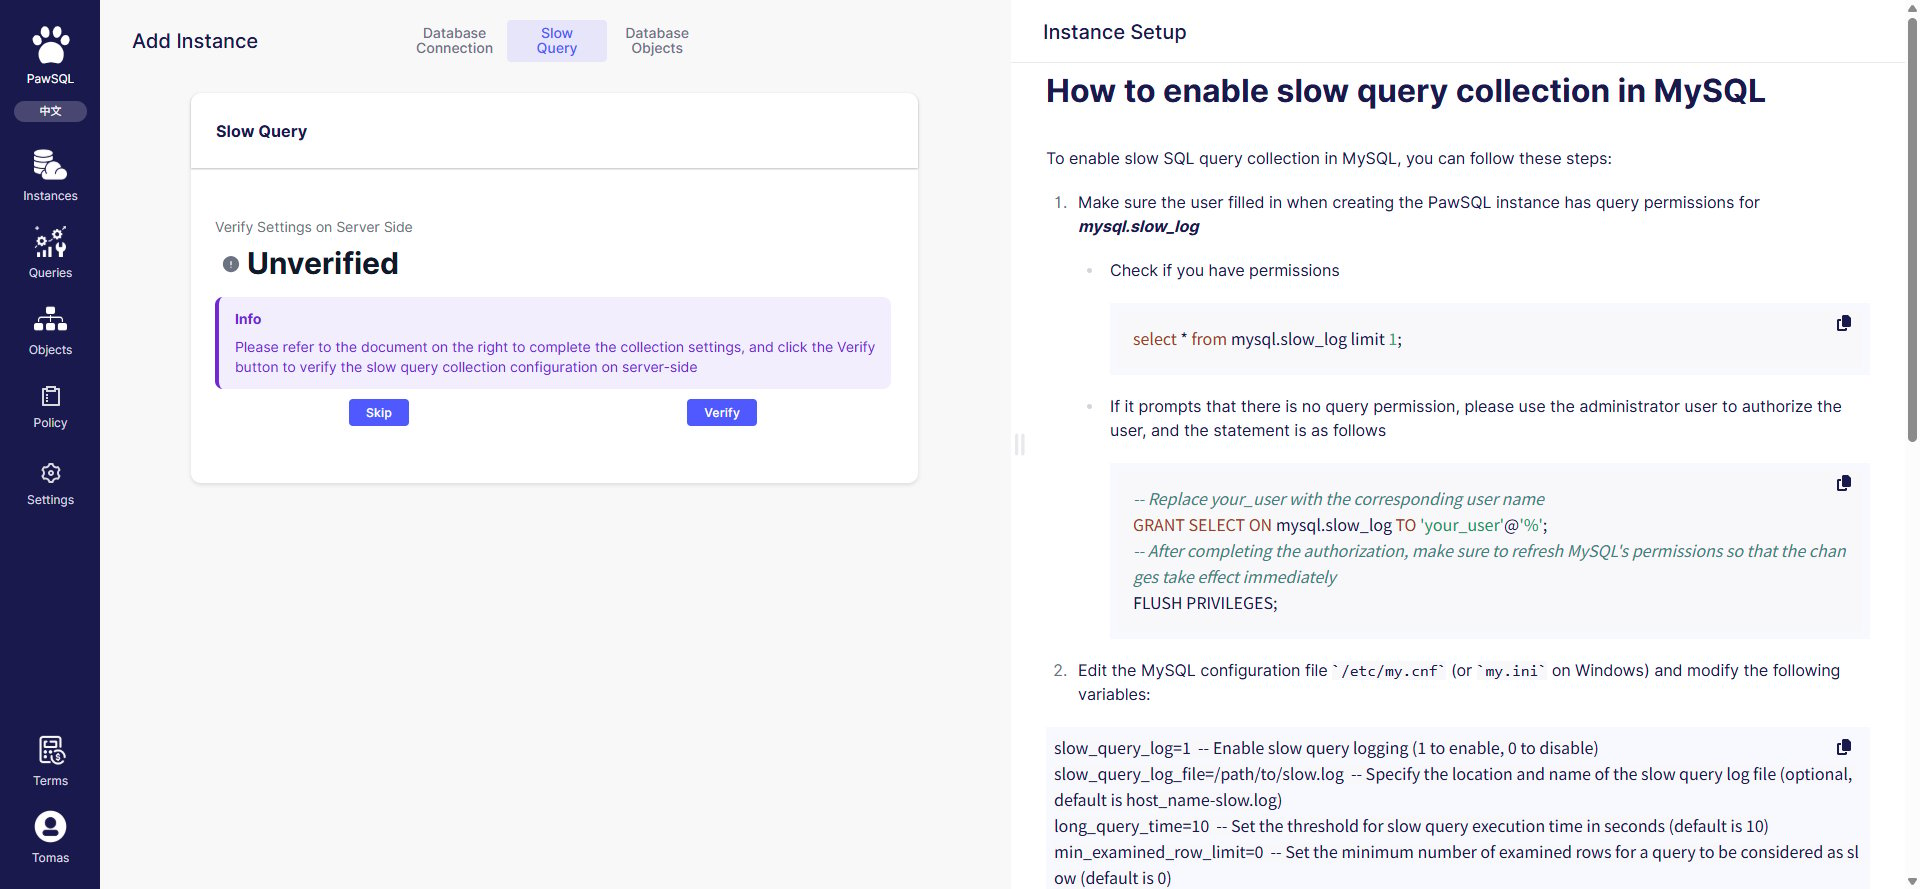
After the connection passes, the wizard enters "Slow query config". This step first tests the target database's slow query log configuration, then sets collection parameters once it passes.
 ### MySQL slow query log requirements
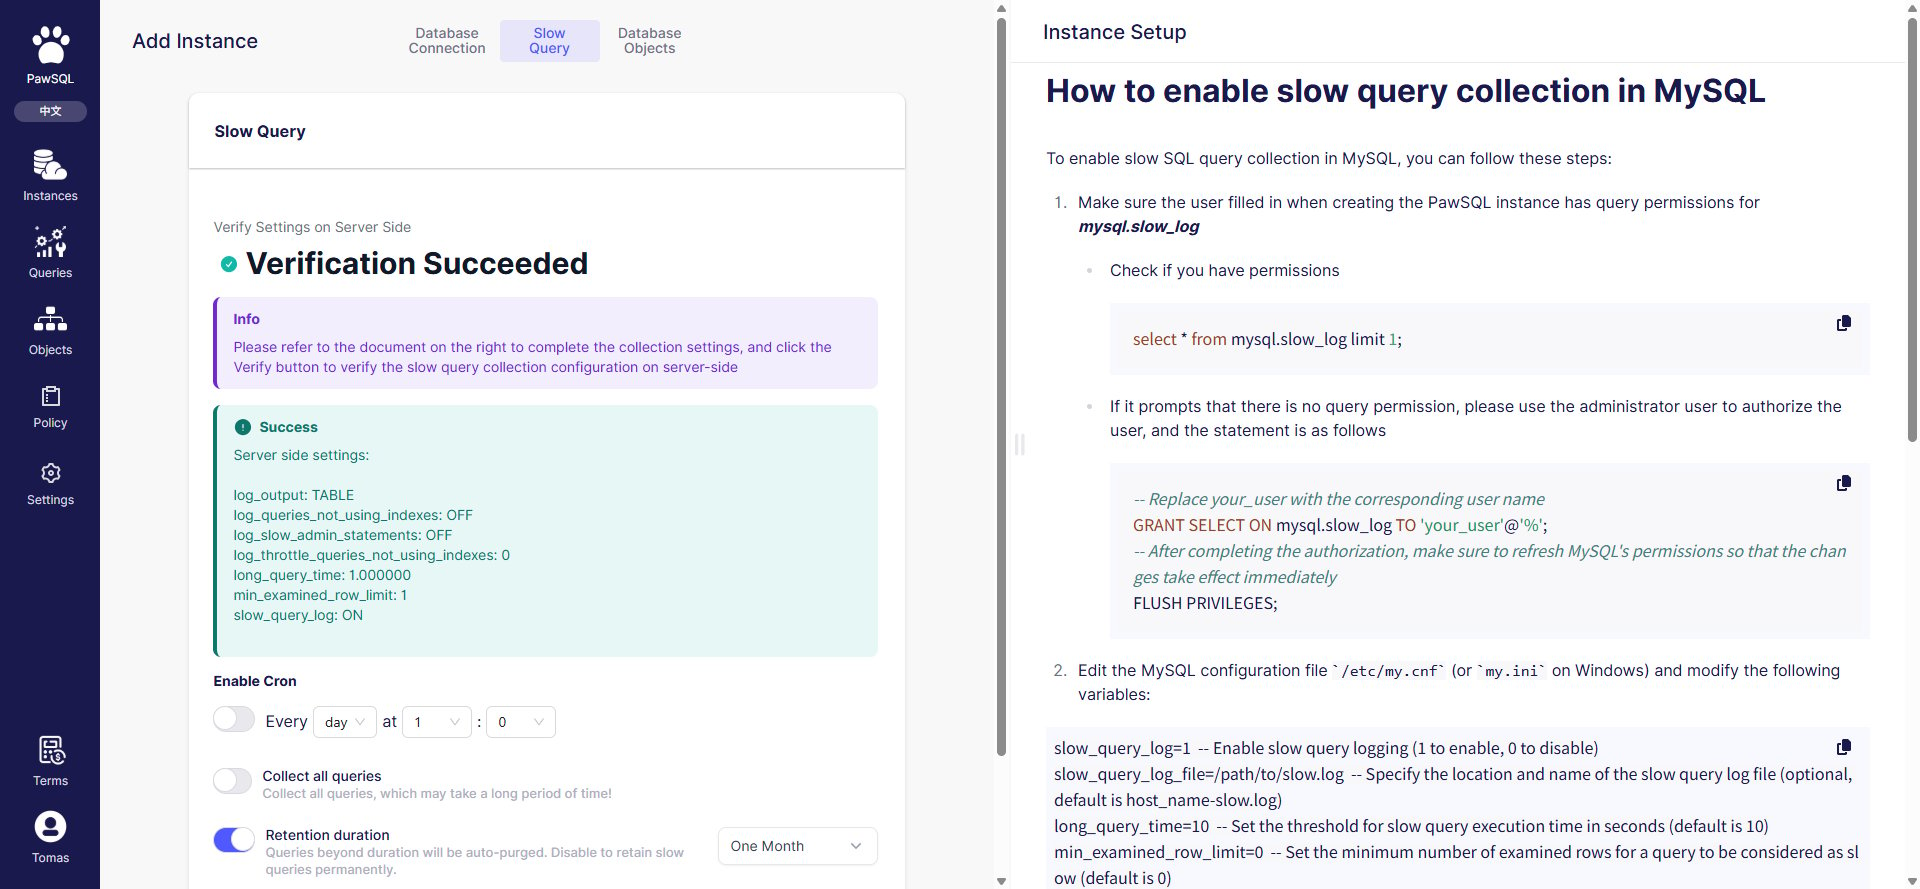
For MySQL, collection depends on the `slow_query_log` settings. On a successful test the page shows the parameters (from a real sample):
| Parameter | Sample value | Meaning |
| ----------------- | ------------ | --------------------------------------------------------------------------- |
| `slow_query_log` | `ON` | The slow query log is enabled |
| `log_output` | `TABLE` | Slow queries are written to a table (`mysql.slow_log`) that PawSQL can read |
| `long_query_time` | `1.0` | Slow query threshold in seconds |
If the test fails, enable the slow query log per the page's "Instance setup guide", or confirm the account has permission to read the slow query log.
## Manual collection
Click "Collect" on the Slow queries page to trigger a collection immediately. Collection runs server-side, and the summary updates when it finishes.
### MySQL slow query log requirements
For MySQL, collection depends on the `slow_query_log` settings. On a successful test the page shows the parameters (from a real sample):
| Parameter | Sample value | Meaning |
| ----------------- | ------------ | --------------------------------------------------------------------------- |
| `slow_query_log` | `ON` | The slow query log is enabled |
| `log_output` | `TABLE` | Slow queries are written to a table (`mysql.slow_log`) that PawSQL can read |
| `long_query_time` | `1.0` | Slow query threshold in seconds |
If the test fails, enable the slow query log per the page's "Instance setup guide", or confirm the account has permission to read the slow query log.
## Manual collection
Click "Collect" on the Slow queries page to trigger a collection immediately. Collection runs server-side, and the summary updates when it finishes.
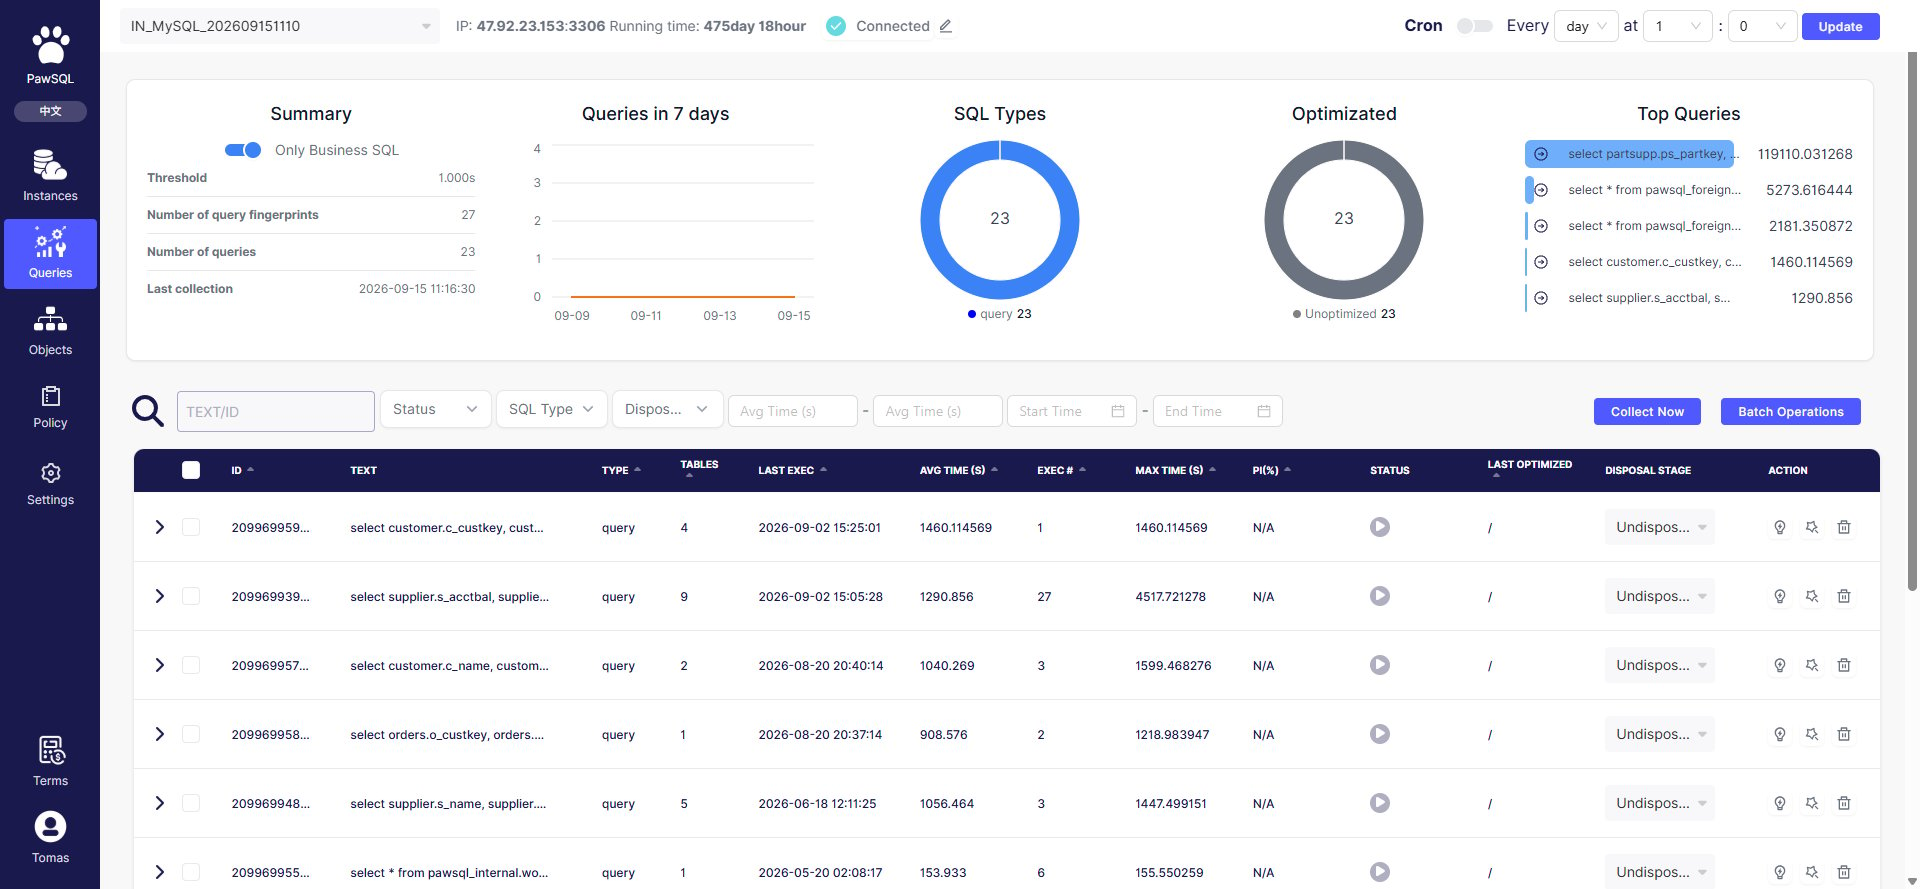 After collection, the summary shows the result (from a real sample):
| Metric | Sample value | Meaning |
| ---------------------- | --------------------- | ---------------------------------------------------- |
| Slow query threshold | `1.000s` | The threshold used for this collection |
| Slow SQL count | `27` | Total slow SQL collected, including non-business SQL |
| Business SQL count | `23` | Count after filtering out non-business SQL |
| Latest collection time | `2026-09-15 11:16:30` | When the most recent collection finished |
## Scheduled collection
At the top of the Slow queries page, turn on "Scheduled collection", set the interval (every N days) and the time (at HH:MM), then click "Update". The platform then collects automatically on schedule.
## Scope and semantics
* Collected SQL comes from the database slow query log, so SQL below the threshold or from a disabled log is not collected;
* The difference between "Slow SQL count" and "Business SQL count" is whether internal/system SQL is filtered — see [SQL Aggregation and Deduplication](/en/user-guide/performance/aggregate-dedup);
* Collection accumulates incrementally; re-collecting refreshes the latest collection time and updates the list.
## Expected Result
After collection, the Slow queries page summary shows the slow query threshold, slow SQL count, business SQL count, and latest collection time for the collected data.
## Before you submit
* [ ] The database slow query log is enabled;
* [ ] The threshold matches the governance goal (too low introduces noise);
* [ ] The account can read the slow query log;
* [ ] The summary updates after manual collection.
## FAQ
| Symptom | Check first |
| --------------------------------------- | --------------------------------------------------------------------------- |
| Test failed | Slow query log disabled, `log_output` not `TABLE`, account permissions |
| No data after collection | No SQL above threshold, empty log, collection task not finished |
| Slow SQL and business SQL counts differ | The "Show business SQL only" filter — see SQL Aggregation and Deduplication |
## Related reading
After collection, the summary shows the result (from a real sample):
| Metric | Sample value | Meaning |
| ---------------------- | --------------------- | ---------------------------------------------------- |
| Slow query threshold | `1.000s` | The threshold used for this collection |
| Slow SQL count | `27` | Total slow SQL collected, including non-business SQL |
| Business SQL count | `23` | Count after filtering out non-business SQL |
| Latest collection time | `2026-09-15 11:16:30` | When the most recent collection finished |
## Scheduled collection
At the top of the Slow queries page, turn on "Scheduled collection", set the interval (every N days) and the time (at HH:MM), then click "Update". The platform then collects automatically on schedule.
## Scope and semantics
* Collected SQL comes from the database slow query log, so SQL below the threshold or from a disabled log is not collected;
* The difference between "Slow SQL count" and "Business SQL count" is whether internal/system SQL is filtered — see [SQL Aggregation and Deduplication](/en/user-guide/performance/aggregate-dedup);
* Collection accumulates incrementally; re-collecting refreshes the latest collection time and updates the list.
## Expected Result
After collection, the Slow queries page summary shows the slow query threshold, slow SQL count, business SQL count, and latest collection time for the collected data.
## Before you submit
* [ ] The database slow query log is enabled;
* [ ] The threshold matches the governance goal (too low introduces noise);
* [ ] The account can read the slow query log;
* [ ] The summary updates after manual collection.
## FAQ
| Symptom | Check first |
| --------------------------------------- | --------------------------------------------------------------------------- |
| Test failed | Slow query log disabled, `log_output` not `TABLE`, account permissions |
| No data after collection | No SQL above threshold, empty log, collection task not finished |
| Slow SQL and business SQL counts differ | The "Show business SQL only" filter — see SQL Aggregation and Deduplication |
## Related reading