> ## Documentation Index
> Fetch the complete documentation index at: https://docs.pawsql.com/llms.txt
> Use this file to discover all available pages before exploring further.
> ## Agent Instructions
> PawSQL 是一个产品:Cloud 是公网部署形态,Engine / Optimizer / Auditor / Advisor / Patroller 是同一产品的组件与交付形态,不是彼此独立的产品。 / PawSQL is a single product: Cloud is the public deployment form, while Engine / Optimizer / Auditor / Advisor / Patroller are components and delivery forms of the same product, not separate products.
> 术语以站内术语表为准:SQL 审核对应英文 SQL Review,查询重写对应 Query Rewrite,索引推荐对应 Index Recommendation;英文内容统一用 Review,不用 Audit。 / Use the site glossary for terminology: 审核 is SQL Review, 重写 is Query Rewrite, 索引推荐 is Index Recommendation; English content uses Review, never Audit.
> 引用能力范围或版本支持时以对应页面为准;标注 unknown、或 status 非 published 的内容表示尚未经产品核实,不应作为事实引用。 / Cite capability scope and version support from the corresponding page; content marked unknown, or with a status other than published, is not yet product-verified and must not be cited as fact.
# Batch Analysis and Optimization
> Select slow SQL on the Slow queries page and run optimize, batch AI optimization, or ignore via batch operation, then configure basic, validation, index, and rule settings on the optimization task page.
Once aggregation and deduplication produce a governance backlog, the next step is to optimize its slow SQL. The Slow queries page offers both per-row and batch entry points; batch operation can optimize multiple slow SQL at once.
## Goal
Optimize the aggregated slow SQL backlog by selecting slow SQL and running optimize, batch AI optimization, or ignore.
## Prerequisites
Slow SQL must already be collected and appear on the Slow queries page.
## Batch operation
Select slow SQL in the table (across pages), then click "Batch operation" to open the menu:
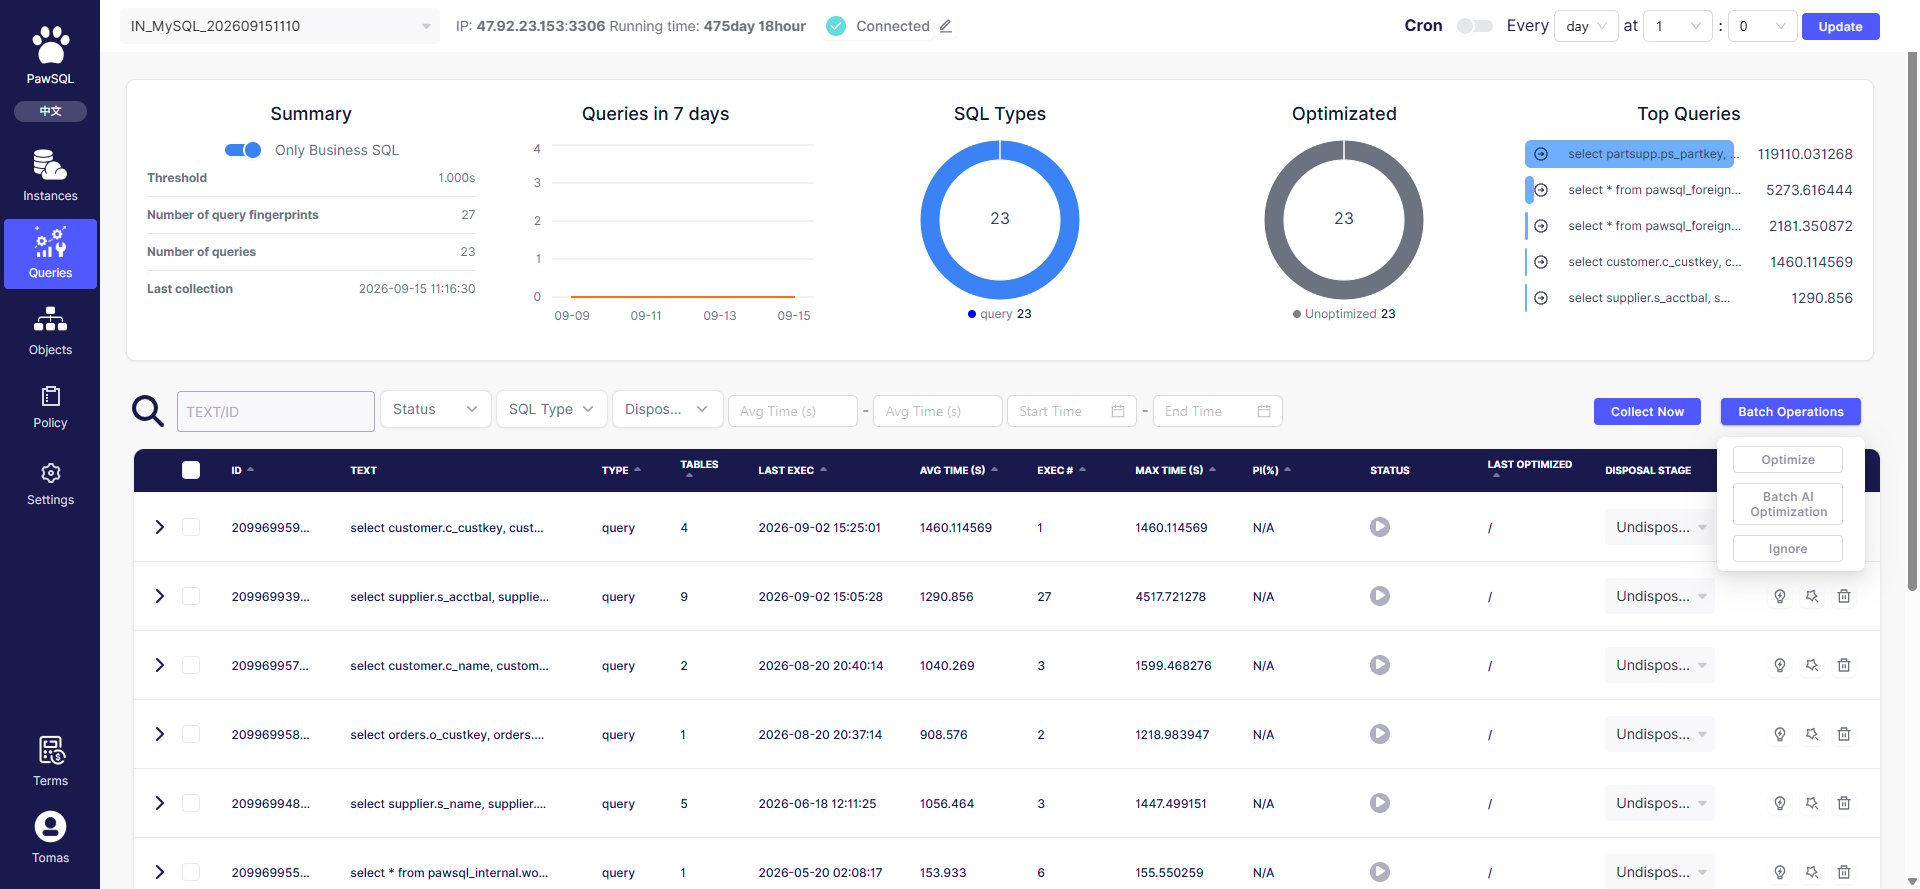 | Operation | Meaning |
| --------------------- | ------------------------------------------------------------------------------------------------------- |
| Optimize | Create an optimization task for the selected slow SQL, generating SQL rewrite and index recommendations |
| Batch AI optimization | Run AI-powered optimization on the selected slow SQL |
| Ignore | Mark the selected slow SQL as ignored, excluding it from the backlog |
## Per-row operations
Each slow SQL's "Operations" column also offers three actions:
| Button | Meaning |
| --------------------------- | ----------------------------------------------------- |
| Optimize | Create an optimization task for that slow SQL |
| AI intelligent optimization | Run AI-powered optimization analysis on that slow SQL |
| Mark ignored | Mark the SQL as ignored |
## Create an optimization task
Clicking "Optimize" opens the "New query optimization" page, bundling the selected queries into an optimization ticket. For the full optimization settings (basic, validation, index, rule) and submission tracking, see [Create an Optimization Ticket](/en/user-guide/performance/create-optimize-ticket).
## Expected Result
The selected slow SQL are turned into an optimization task that generates SQL rewrite and index recommendations, shown on the optimization task page.
## Verification
Confirm the optimization task was created and its results appear in the "Optimization status", "Last optimization", and "Performance gain" columns on the Slow queries page.
## FAQ
| Symptom | Check first |
| ---------------------------- | ------------------------------------------------------- |
| No action in batch operation | Whether slow SQL rows are selected |
| Optimization task hangs | Task queue, concurrency limits, analysis service status |
| Performance gain shows N/A | Whether optimization ran and completed |
## Related reading
| Operation | Meaning |
| --------------------- | ------------------------------------------------------------------------------------------------------- |
| Optimize | Create an optimization task for the selected slow SQL, generating SQL rewrite and index recommendations |
| Batch AI optimization | Run AI-powered optimization on the selected slow SQL |
| Ignore | Mark the selected slow SQL as ignored, excluding it from the backlog |
## Per-row operations
Each slow SQL's "Operations" column also offers three actions:
| Button | Meaning |
| --------------------------- | ----------------------------------------------------- |
| Optimize | Create an optimization task for that slow SQL |
| AI intelligent optimization | Run AI-powered optimization analysis on that slow SQL |
| Mark ignored | Mark the SQL as ignored |
## Create an optimization task
Clicking "Optimize" opens the "New query optimization" page, bundling the selected queries into an optimization ticket. For the full optimization settings (basic, validation, index, rule) and submission tracking, see [Create an Optimization Ticket](/en/user-guide/performance/create-optimize-ticket).
## Expected Result
The selected slow SQL are turned into an optimization task that generates SQL rewrite and index recommendations, shown on the optimization task page.
## Verification
Confirm the optimization task was created and its results appear in the "Optimization status", "Last optimization", and "Performance gain" columns on the Slow queries page.
## FAQ
| Symptom | Check first |
| ---------------------------- | ------------------------------------------------------- |
| No action in batch operation | Whether slow SQL rows are selected |
| Optimization task hangs | Task queue, concurrency limits, analysis service status |
| Performance gain shows N/A | Whether optimization ran and completed |
## Related reading