> ## Documentation Index
> Fetch the complete documentation index at: https://docs.pawsql.com/llms.txt
> Use this file to discover all available pages before exploring further.
> ## Agent Instructions
> PawSQL 是一个产品:Cloud 是公网部署形态,Engine / Optimizer / Auditor / Advisor / Patroller 是同一产品的组件与交付形态,不是彼此独立的产品。 / PawSQL is a single product: Cloud is the public deployment form, while Engine / Optimizer / Auditor / Advisor / Patroller are components and delivery forms of the same product, not separate products.
> 术语以站内术语表为准:SQL 审核对应英文 SQL Review,查询重写对应 Query Rewrite,索引推荐对应 Index Recommendation;英文内容统一用 Review,不用 Audit。 / Use the site glossary for terminology: 审核 is SQL Review, 重写 is Query Rewrite, 索引推荐 is Index Recommendation; English content uses Review, never Audit.
> 引用能力范围或版本支持时以对应页面为准;标注 unknown、或 status 非 published 的内容表示尚未经产品核实,不应作为事实引用。 / Cite capability scope and version support from the corresponding page; content marked unknown, or with a status other than published, is not yet product-verified and must not be cited as fact.
# SQL Aggregation and Deduplication
> After collection, slow SQL is automatically aggregated by structure and deduplicated, with a "Show business SQL only" filter that removes internal SQL and summary/charts that describe the backlog.
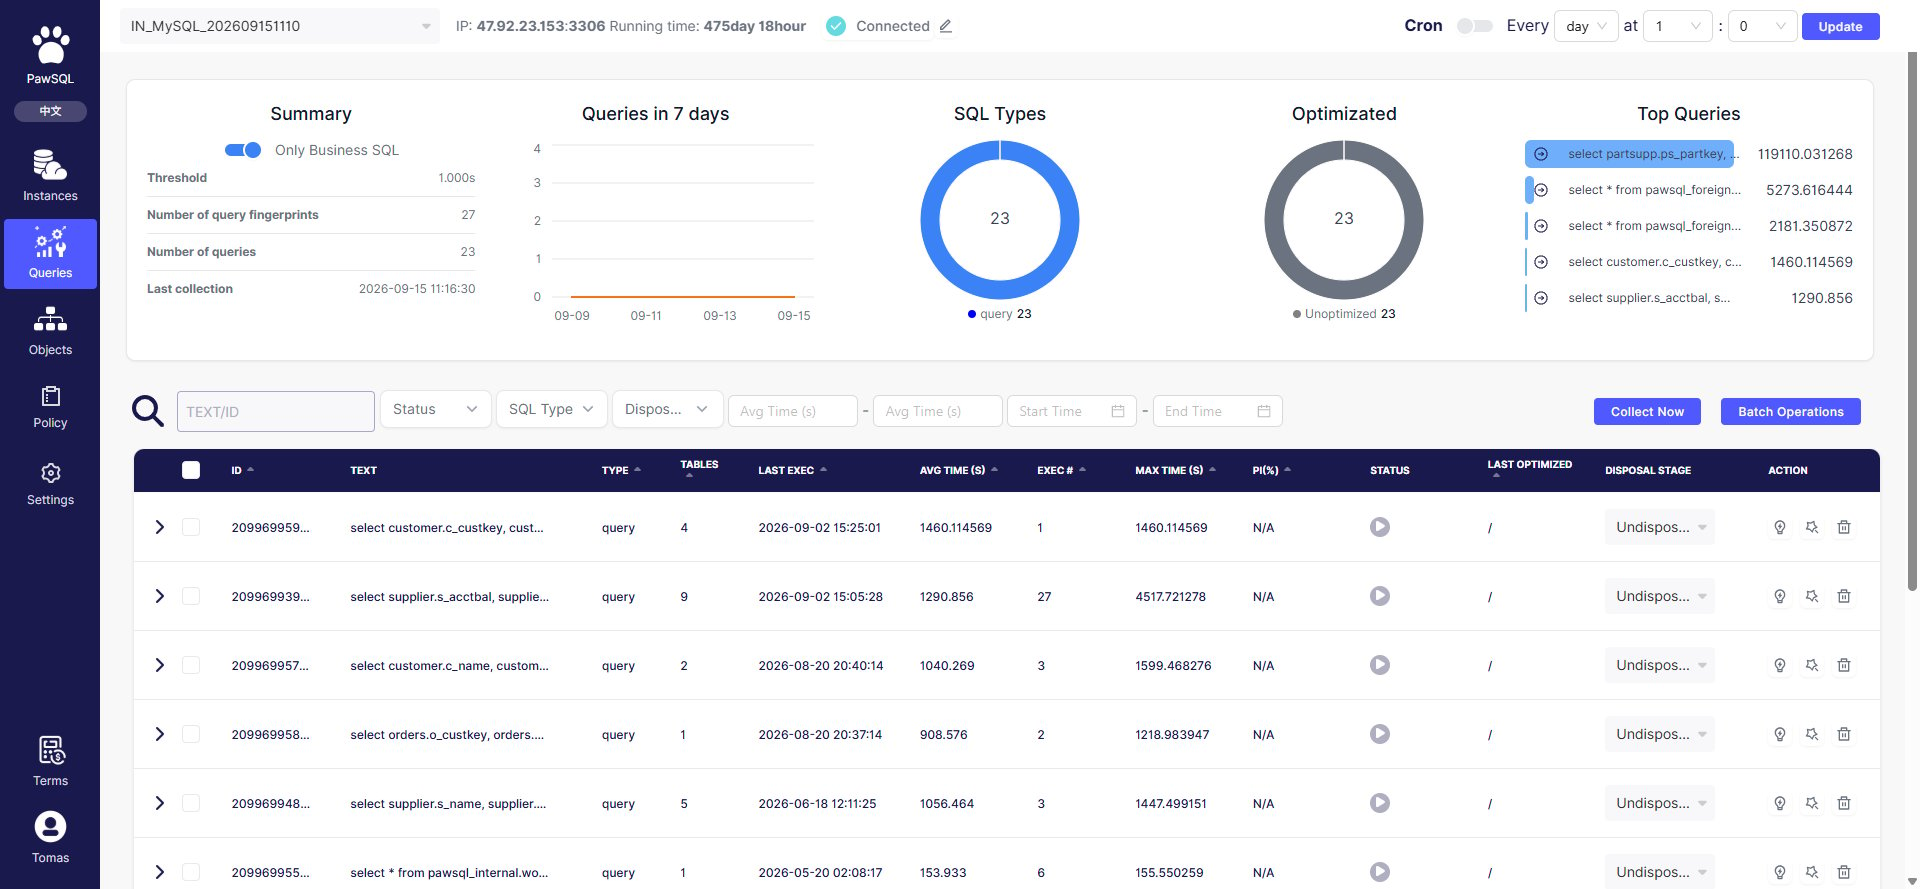
The same SQL is executed thousands of times in a slow query log, and listing each execution has no governance value. PawSQL aggregates and deduplicates collected SQL by structure, merging identical-structure SQL into a single row described by execution count, average latency, and max latency. The Slow queries page summary, charts, and table are all based on the aggregated result.
 ## Goal
Represent each distinct SQL structure once in the governance backlog by aggregating and deduplicating collected slow SQL.
## Prerequisites
Slow SQL must already be collected into the platform; aggregation runs on the collection result.
## Steps
After collection, PawSQL aggregates the slow SQL automatically. Review the backlog with the "Show business SQL only" toggle, the summary metrics, the distribution charts, the table, and the filters.
## Show business SQL only
The "Show business SQL only" toggle in the top-right of the summary filters out internal/system SQL. It is on by default. Turn it off to show all slow SQL.
Real sample: one instance collected `27` slow SQL, of which `23` were business SQL — the remaining `4` were internal/system SQL (queries on `pawsql_internal.*`, `pawsql_foreign.*`, and similar tables).
## Summary metrics
| Metric | Meaning |
| ---------------------- | ---------------------------------------------------- |
| Slow query threshold | The threshold used for collection, in seconds |
| Slow SQL count | Total slow SQL collected, including non-business SQL |
| Business SQL count | Count after filtering out internal/system SQL |
| Latest collection time | When the most recent collection finished |
## Distribution charts
The Slow queries page summarizes the aggregated backlog with four charts:
* **7-day slow SQL**: the daily count trend of slow SQL;
* **SQL type**: the count distribution by SQL type (e.g. `query`);
* **Optimization status**: the count distribution by status such as not optimized / optimized;
* **Average latency**: the slowest SQL by average latency, to prioritize.
In a real sample, all 23 business SQL were of type `query` and status "not optimized", with the slowest one averaging `119110.03` seconds.
## Table fields
The aggregated slow query table lists each SQL with its aggregate metrics:
| Column | Meaning |
| -------------------- | ------------------------------------------------------------------ |
| ID | The SQL's unique identifier |
| Text | The SQL statement (parameterized) |
| Type | SQL type (e.g. `query`) |
| Tables | Number of tables involved |
| Last execution | The most recent execution time |
| Avg latency (s) | Aggregated average execution latency |
| Execution count | Number of executions in the aggregation period |
| Max latency (s) | The single largest execution latency |
| Performance gain (%) | Improvement relative to the original SQL; `N/A` when not optimized |
| Optimization status | Not optimized / optimized |
| Last optimization | The most recent optimization time |
| Disposition stage | Not disposed / disposing / disposed |
## Filtering and sorting
Above the table there are filters: search slow SQL or ID, optimization status, SQL type, disposition stage, average latency range, and execution time range. Column headers support sorting to locate priority SQL by average latency or execution count.
## Expected Result
The Slow queries page shows the aggregated backlog: a summary of counts, four distribution charts, and one table row per distinct SQL structure.
## Verification
Confirm the summary, charts, and table reflect the aggregated result, and that toggling "Show business SQL only" changes the business SQL count.
## Related reading
## Goal
Represent each distinct SQL structure once in the governance backlog by aggregating and deduplicating collected slow SQL.
## Prerequisites
Slow SQL must already be collected into the platform; aggregation runs on the collection result.
## Steps
After collection, PawSQL aggregates the slow SQL automatically. Review the backlog with the "Show business SQL only" toggle, the summary metrics, the distribution charts, the table, and the filters.
## Show business SQL only
The "Show business SQL only" toggle in the top-right of the summary filters out internal/system SQL. It is on by default. Turn it off to show all slow SQL.
Real sample: one instance collected `27` slow SQL, of which `23` were business SQL — the remaining `4` were internal/system SQL (queries on `pawsql_internal.*`, `pawsql_foreign.*`, and similar tables).
## Summary metrics
| Metric | Meaning |
| ---------------------- | ---------------------------------------------------- |
| Slow query threshold | The threshold used for collection, in seconds |
| Slow SQL count | Total slow SQL collected, including non-business SQL |
| Business SQL count | Count after filtering out internal/system SQL |
| Latest collection time | When the most recent collection finished |
## Distribution charts
The Slow queries page summarizes the aggregated backlog with four charts:
* **7-day slow SQL**: the daily count trend of slow SQL;
* **SQL type**: the count distribution by SQL type (e.g. `query`);
* **Optimization status**: the count distribution by status such as not optimized / optimized;
* **Average latency**: the slowest SQL by average latency, to prioritize.
In a real sample, all 23 business SQL were of type `query` and status "not optimized", with the slowest one averaging `119110.03` seconds.
## Table fields
The aggregated slow query table lists each SQL with its aggregate metrics:
| Column | Meaning |
| -------------------- | ------------------------------------------------------------------ |
| ID | The SQL's unique identifier |
| Text | The SQL statement (parameterized) |
| Type | SQL type (e.g. `query`) |
| Tables | Number of tables involved |
| Last execution | The most recent execution time |
| Avg latency (s) | Aggregated average execution latency |
| Execution count | Number of executions in the aggregation period |
| Max latency (s) | The single largest execution latency |
| Performance gain (%) | Improvement relative to the original SQL; `N/A` when not optimized |
| Optimization status | Not optimized / optimized |
| Last optimization | The most recent optimization time |
| Disposition stage | Not disposed / disposing / disposed |
## Filtering and sorting
Above the table there are filters: search slow SQL or ID, optimization status, SQL type, disposition stage, average latency range, and execution time range. Column headers support sorting to locate priority SQL by average latency or execution count.
## Expected Result
The Slow queries page shows the aggregated backlog: a summary of counts, four distribution charts, and one table row per distinct SQL structure.
## Verification
Confirm the summary, charts, and table reflect the aggregated result, and that toggling "Show business SQL only" changes the business SQL count.
## Related reading