> ## Documentation Index
> Fetch the complete documentation index at: https://docs.pawsql.com/llms.txt
> Use this file to discover all available pages before exploring further.
> ## Agent Instructions
> PawSQL 是一个产品:Cloud 是公网部署形态,Engine / Optimizer / Auditor / Advisor / Patroller 是同一产品的组件与交付形态,不是彼此独立的产品。 / PawSQL is a single product: Cloud is the public deployment form, while Engine / Optimizer / Auditor / Advisor / Patroller are components and delivery forms of the same product, not separate products.
> 术语以站内术语表为准:SQL 审核对应英文 SQL Review,查询重写对应 Query Rewrite,索引推荐对应 Index Recommendation;英文内容统一用 Review,不用 Audit。 / Use the site glossary for terminology: 审核 is SQL Review, 重写 is Query Rewrite, 索引推荐 is Index Recommendation; English content uses Review, never Audit.
> 引用能力范围或版本支持时以对应页面为准;标注 unknown、或 status 非 published 的内容表示尚未经产品核实,不应作为事实引用。 / Cite capability scope and version support from the corresponding page; content marked unknown, or with a status other than published, is not yet product-verified and must not be cited as fact.
# Performance Governance Workflow
> The Performance Patroller connects database instances, collects slow SQL, and patrols database objects to surface performance and structural risks, with batch optimization and governance tracking.
The Performance Patroller continuously collects slow queries and patrols database objects on connected instances, turning scattered performance problems into a measurable, trackable, batch-optimizable governance backlog. It is separate from the single-SQL optimization flow on the Optimize platform and targets the ongoing governance of hundreds of slow SQL and object defects across an instance.
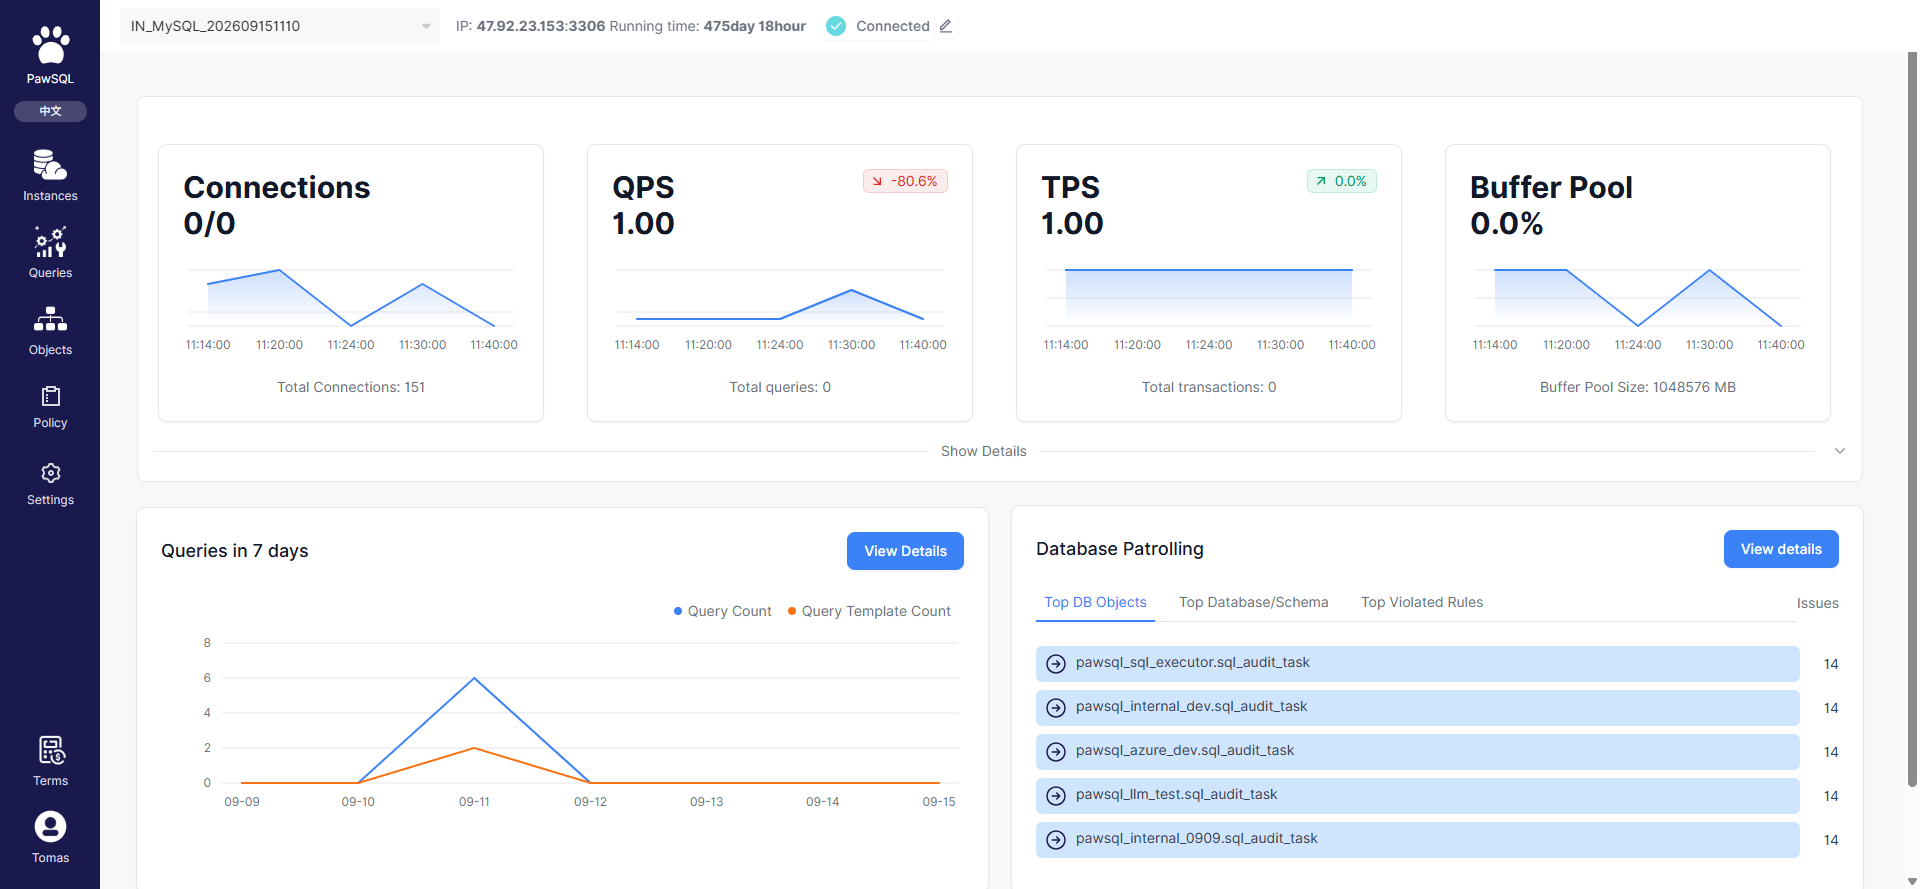 ## Governance workflow
Connecting database instances is the starting point, followed by two tracks — Slow query governance and Object patrol — converging on progress tracking:
Add an instance, fill in connection details, and complete slow query and patrol configuration.
### Slow query governance
Collect slow SQL from the database slow query log, manually or on a schedule.
Aggregate collected SQL by structure, filter to business SQL, and form the governance backlog.
Run optimization or AI optimization on selected slow SQL to generate rewrite and index recommendations.
Bundle selected slow SQL into an optimization ticket, configure settings, and submit for tracking.
### Object patrol
Assign a patrol template to the instance and patrol database objects manually or on a schedule.
Review risk distribution and top issues from the database-object perspective.
Bundle objects with anomalies into a remediation ticket.
Track governance progress runs throughout: track each SQL and object via optimization status, disposition stage, and performance improvement.
```mermaid theme={null}
flowchart LR
A["Connect instances"] --> B["Collect slow queries"]
A --> C["Object patrol task"]
B --> D["Aggregate & deduplicate"]
D --> E["Batch optimize"]
E --> F["Optimization ticket"]
C --> G["Patrol report"]
G --> H["Patrol issue ticket"]
F --> I["Track progress"]
H --> I
```
## Core Concepts
| Concept | Purpose |
| ------------------- | ---------------------------------------------------------------------------------------------------------- |
| Instance | A connected target database with connection info, slow query threshold, and patrol template config |
| Slow query | SQL collected and aggregated from the slow query log, with latency, execution count, and governance status |
| Patrol template | Defines the audit rules and severities applied during patrol |
| Database object | Tables in the instance, with column count, row count, index count, and patrol anomalies |
| Patrol report | Summarizes object count, severity distribution, and top rules/objects |
| Optimization ticket | A trackable optimization record bundling a batch of slow SQL with optimization settings |
| Patrol issue ticket | A trackable remediation record bundling objects with patrol findings |
## In this section
### Onboarding and tracking
### Slow query governance
### Object patrol
## Start by role
| Role | Recommended pages | Main responsibilities |
| -------------------- | ----------------------------------- | ----------------------------------------------------------------------- |
| DBA | Instance onboarding, patrol reports | Maintain connections and patrol templates, judge structural risk |
| Performance engineer | Slow queries, batch optimization | Analyze slow SQL, run batch optimization, track improvement |
| Developer | Slow queries, governance progress | Handle slow SQL and object defects owned by the team |
| Project admin | Instance overview, configuration | Maintain instance list, collection/patrol schedules, and team ownership |
## Before you start
* The target database is reachable from the PawSQL server (connection validation runs server-side);
* You have the host, port, username, password, and target database name;
* The database slow query log is enabled and readable before collecting slow SQL;
* The patrol template matches the target database type;
* Your account has permission to add instances and view patrol data.
Patrol and optimization recommendations assist analysis; they do not replace business review, test validation, backup, approval, or release controls.
## Related reading
* Single-SQL optimization on the Optimize platform: [Optimization workflow](/en/user-guide/optimization/)
* Database context: [Workspaces and context](/en/user-guide/workspaces/)
## Governance workflow
Connecting database instances is the starting point, followed by two tracks — Slow query governance and Object patrol — converging on progress tracking:
Add an instance, fill in connection details, and complete slow query and patrol configuration.
### Slow query governance
Collect slow SQL from the database slow query log, manually or on a schedule.
Aggregate collected SQL by structure, filter to business SQL, and form the governance backlog.
Run optimization or AI optimization on selected slow SQL to generate rewrite and index recommendations.
Bundle selected slow SQL into an optimization ticket, configure settings, and submit for tracking.
### Object patrol
Assign a patrol template to the instance and patrol database objects manually or on a schedule.
Review risk distribution and top issues from the database-object perspective.
Bundle objects with anomalies into a remediation ticket.
Track governance progress runs throughout: track each SQL and object via optimization status, disposition stage, and performance improvement.
```mermaid theme={null}
flowchart LR
A["Connect instances"] --> B["Collect slow queries"]
A --> C["Object patrol task"]
B --> D["Aggregate & deduplicate"]
D --> E["Batch optimize"]
E --> F["Optimization ticket"]
C --> G["Patrol report"]
G --> H["Patrol issue ticket"]
F --> I["Track progress"]
H --> I
```
## Core Concepts
| Concept | Purpose |
| ------------------- | ---------------------------------------------------------------------------------------------------------- |
| Instance | A connected target database with connection info, slow query threshold, and patrol template config |
| Slow query | SQL collected and aggregated from the slow query log, with latency, execution count, and governance status |
| Patrol template | Defines the audit rules and severities applied during patrol |
| Database object | Tables in the instance, with column count, row count, index count, and patrol anomalies |
| Patrol report | Summarizes object count, severity distribution, and top rules/objects |
| Optimization ticket | A trackable optimization record bundling a batch of slow SQL with optimization settings |
| Patrol issue ticket | A trackable remediation record bundling objects with patrol findings |
## In this section
### Onboarding and tracking
### Slow query governance
### Object patrol
## Start by role
| Role | Recommended pages | Main responsibilities |
| -------------------- | ----------------------------------- | ----------------------------------------------------------------------- |
| DBA | Instance onboarding, patrol reports | Maintain connections and patrol templates, judge structural risk |
| Performance engineer | Slow queries, batch optimization | Analyze slow SQL, run batch optimization, track improvement |
| Developer | Slow queries, governance progress | Handle slow SQL and object defects owned by the team |
| Project admin | Instance overview, configuration | Maintain instance list, collection/patrol schedules, and team ownership |
## Before you start
* The target database is reachable from the PawSQL server (connection validation runs server-side);
* You have the host, port, username, password, and target database name;
* The database slow query log is enabled and readable before collecting slow SQL;
* The patrol template matches the target database type;
* Your account has permission to add instances and view patrol data.
Patrol and optimization recommendations assist analysis; they do not replace business review, test validation, backup, approval, or release controls.
## Related reading
* Single-SQL optimization on the Optimize platform: [Optimization workflow](/en/user-guide/optimization/)
* Database context: [Workspaces and context](/en/user-guide/workspaces/)